#Load package
library("mgrtibbles")
#Set seed for random sampling
set.seed("483")
#mushroom_tbl tibble for demonstration
mushroom_tbl <- mgrtibbles::mushroom_tbl |>
    #Random sample of 150 rows
    dplyr::slice_sample(n = 150, replace=FALSE)
#Reset random seed to normal operation
set.seed(NULL)Scale values
The axes of continuous variables on plots can be scaled to view the data in different ways. This includes:
- Changing various options of a continuous scale with
ggplot2::scale_x_continuousandggplot2::scale_y_continuous- Includes the axes limits and the breaks
- Transforming the axes scale from continuous (1,2,3…) to log10 or square root
Dataset
We’ll recreate many of the plots in the geom_point() chapter, so we’ll load the mushroom_tbl data from the mgrtibbles package (hyperlink includes install instructions). We will extract a random sample of 150 rows with slice_sample().
Continuous scale
There are many arguments that can be included in ggplot2::scale_x_continuous and ggplot2::scale_y_continuous to affect each of the axis scales. These include:
name=: set the label name (can be used instead oflabs())breaks=: specify the numbers to be displayed as the major breaks on the scalelimits=: Set the upper and lower limit of the axis scale
Note: When using limits R will inform you of the number of rows (i.e. observations) that are not included in the plot. The below plot is missing 70 rows/observations.
mushroom_tbl |>
    ggplot2::ggplot(aes(x = stem_width, y = stem_height)) +
    ggplot2::geom_point() +
    ggplot2::scale_x_continuous(name="Stem width",
                                breaks=c(0:10),
                                limits = c(0,10)) +
    ggplot2::scale_y_continuous(name="Stem height",
                                breaks=seq(from=0, to=20, by=2),
                                limits = c(0,20))
Warning: Removed 70 rows containing missing values or values outside the scale range
(`geom_point()`).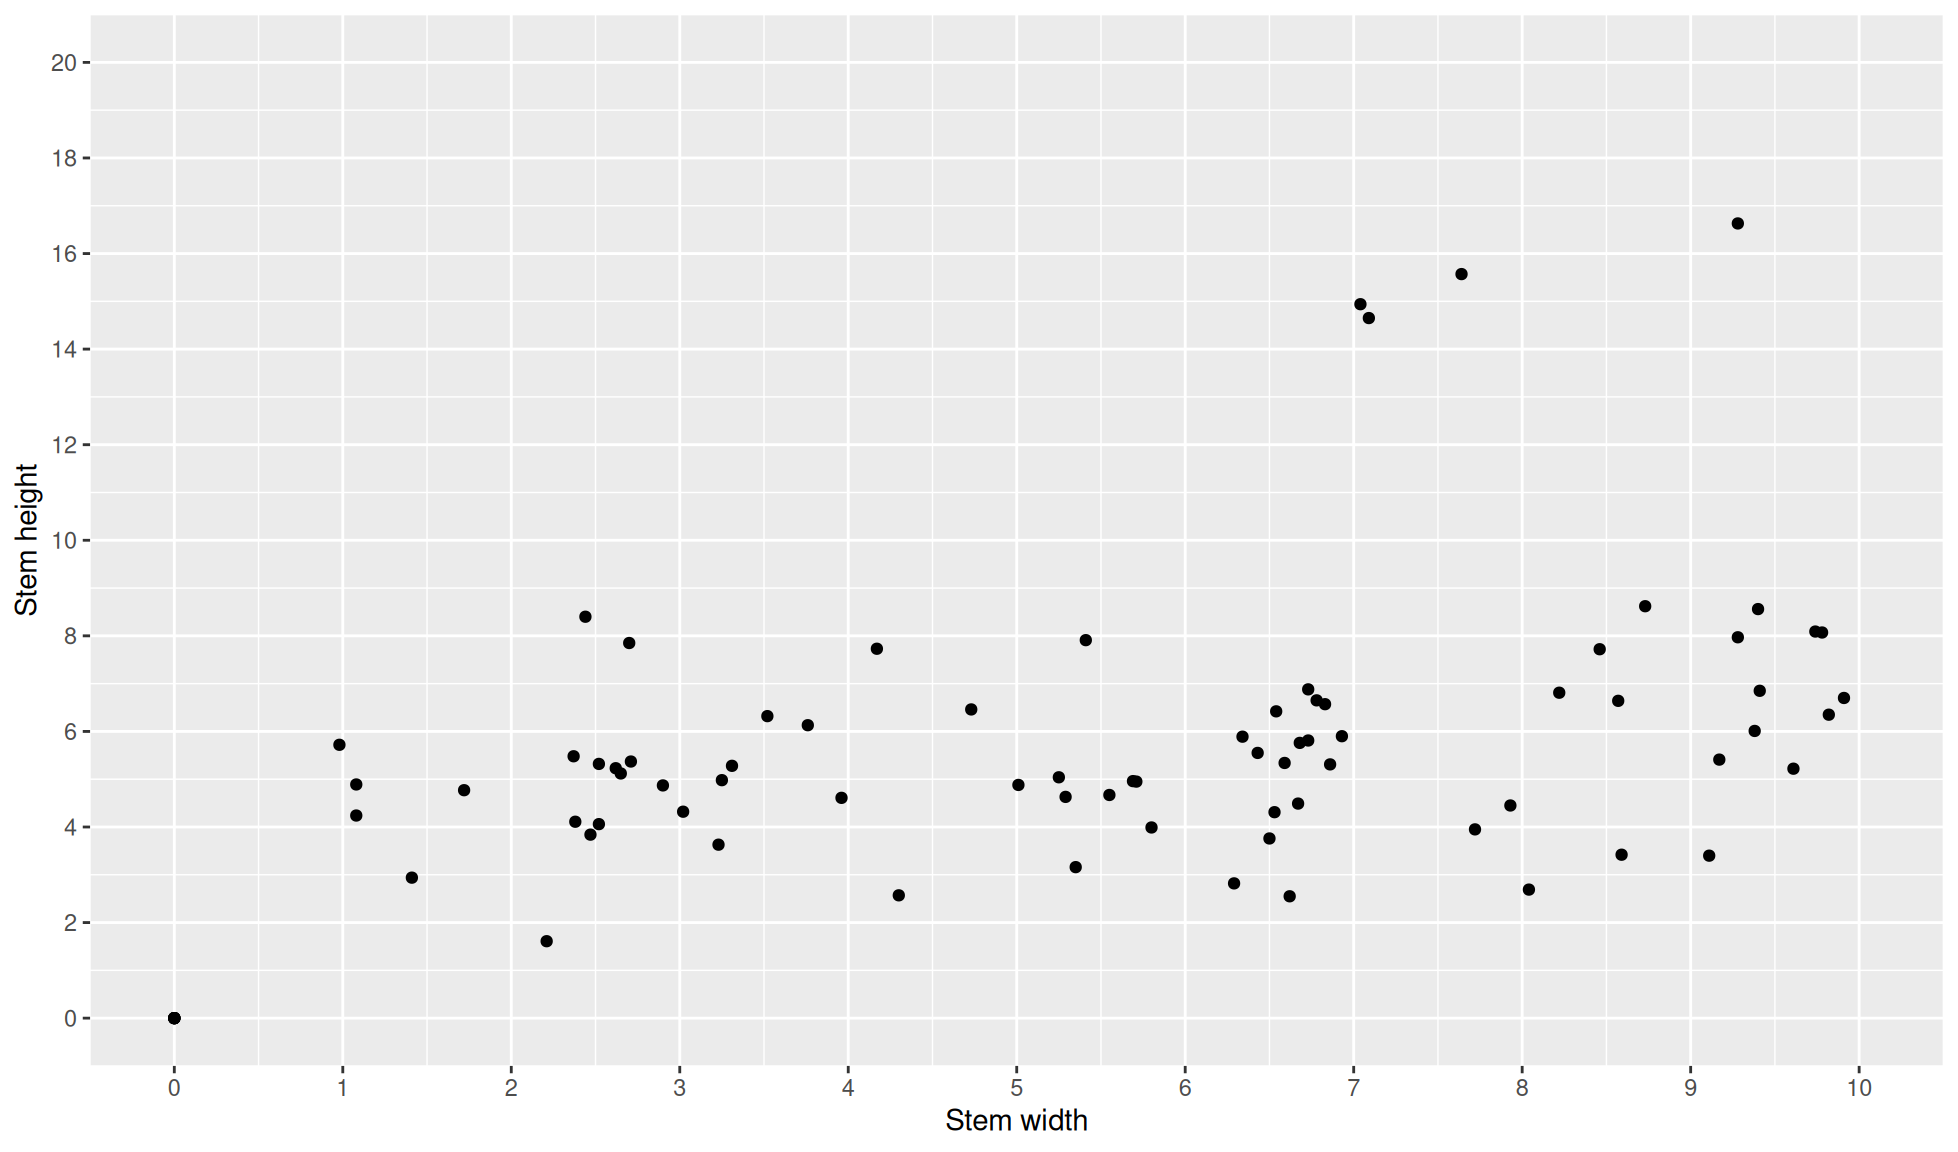
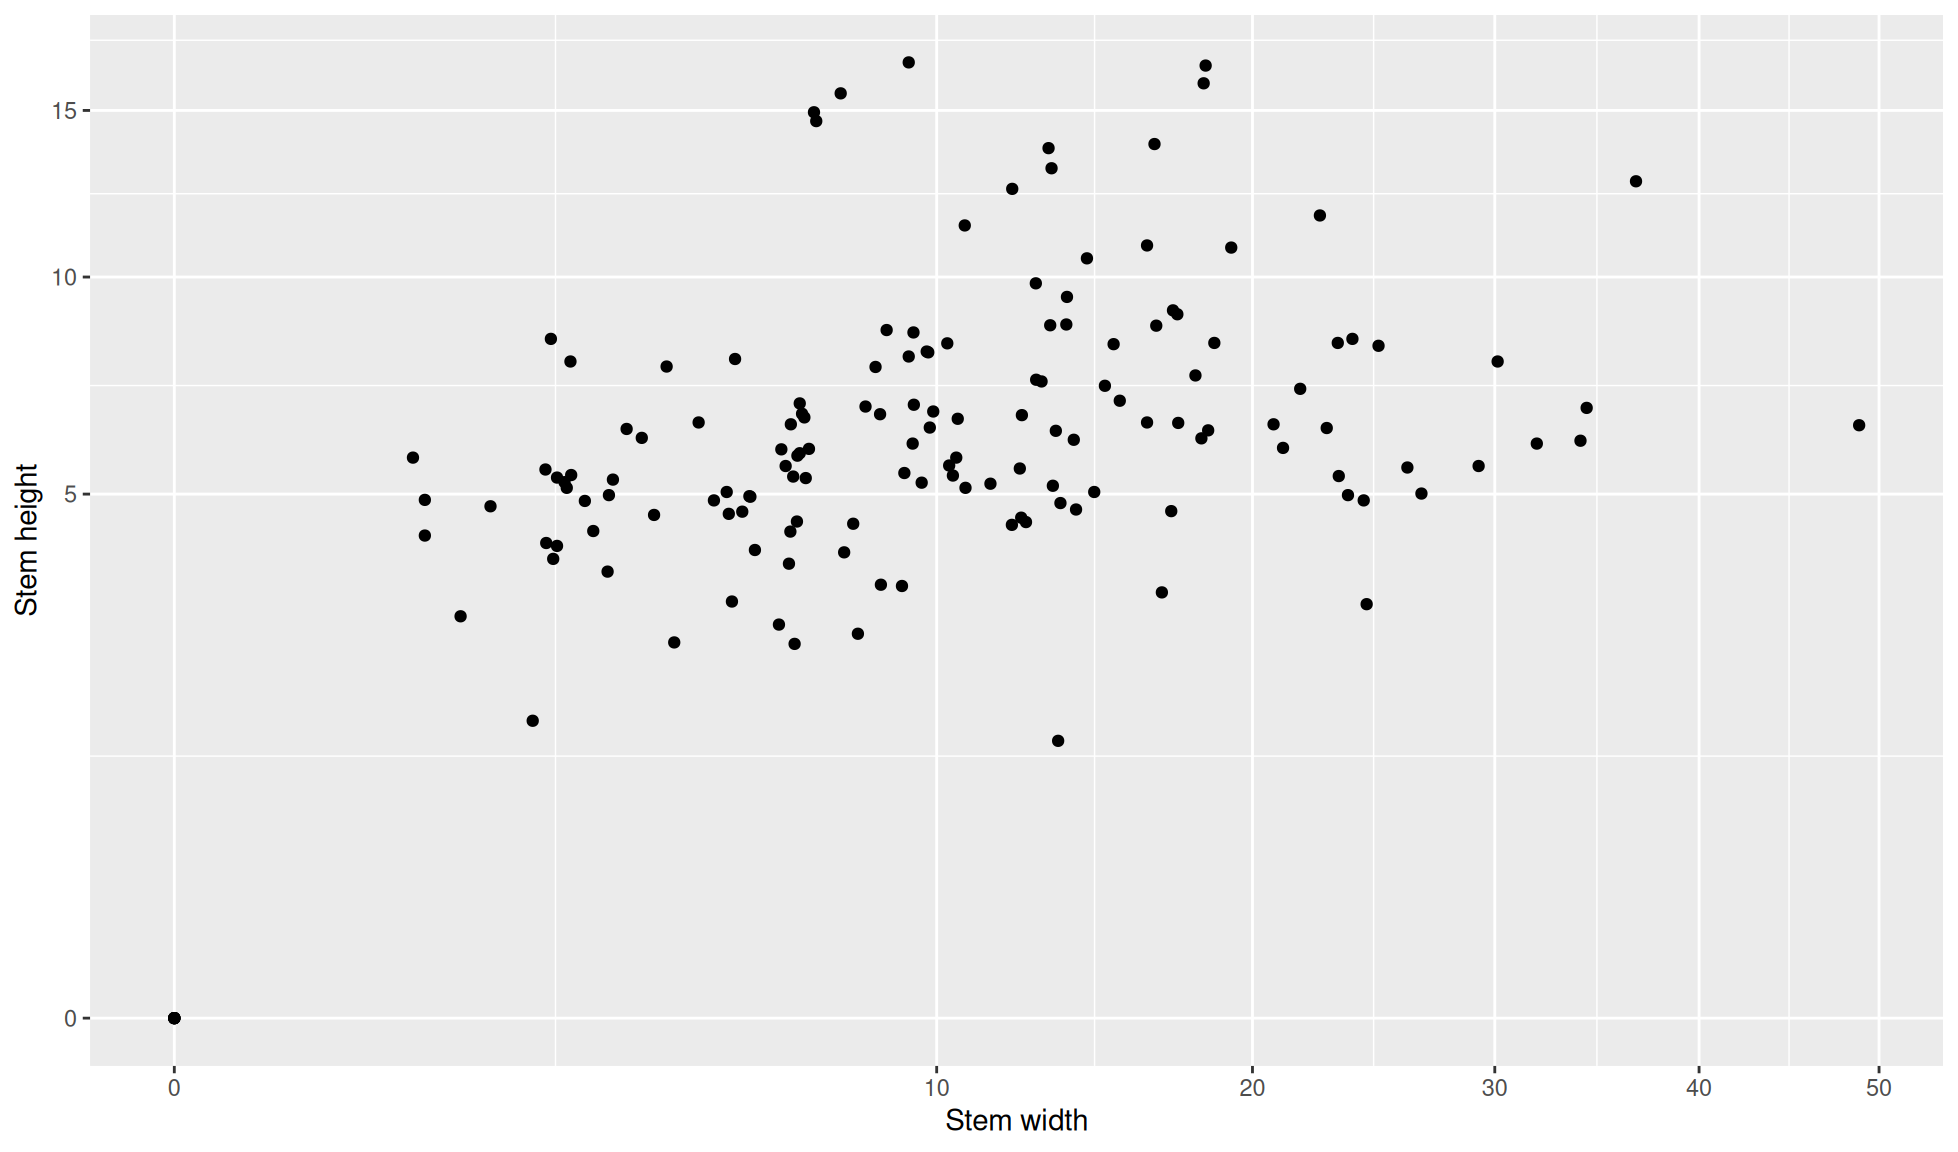
Scale transformation
Certain data is better suited to be displayed with log10 or square root scales.
These transformations can be carried out with other scale functions that take the same options as ggplot2::scale_x_continuous() and ggplot2::scale_y_continuous().
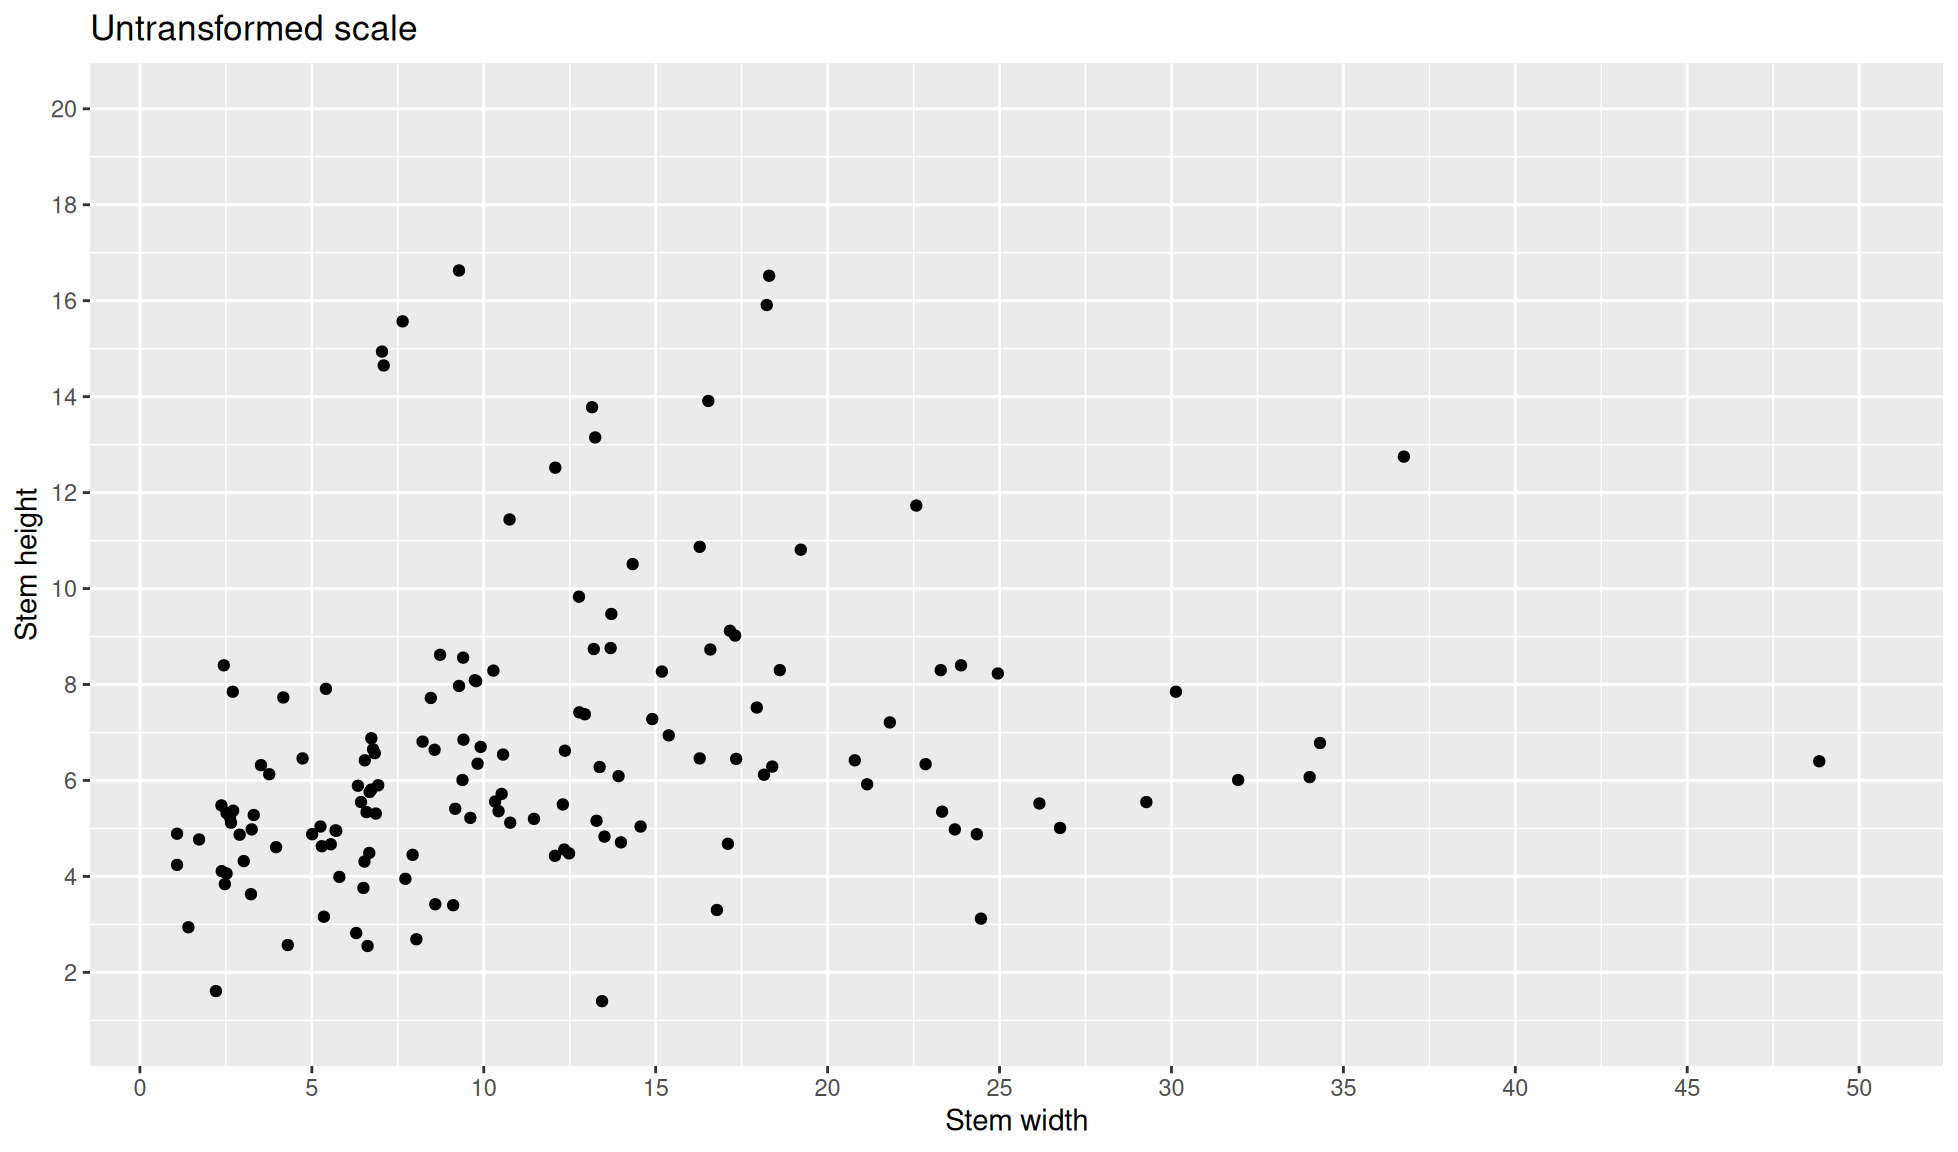
It is important to note that the values displayed on the axes are not transformed (i.e. values of cm will stay as cm and not log10(cm)). Instead, the distance between values (scale) are transformed. Please see the expandable box below for a comparison.
Below are the same plot with and without scale transformation.
The breaks are chosen to be identical in both for clarity. Notice the scale difference (i.e where the points and values are placed) but the actual values on the breaks are the same (i.e. x values go from 0-50 and y values go from 0-20).
Log10
To convert an axis scale to log10 one of the below components needs to be added:
ggplot2::scale_x_log10(): transform x axis to log10 scaleggplot2::scale_y_log10(): transform y axis to log10 scale
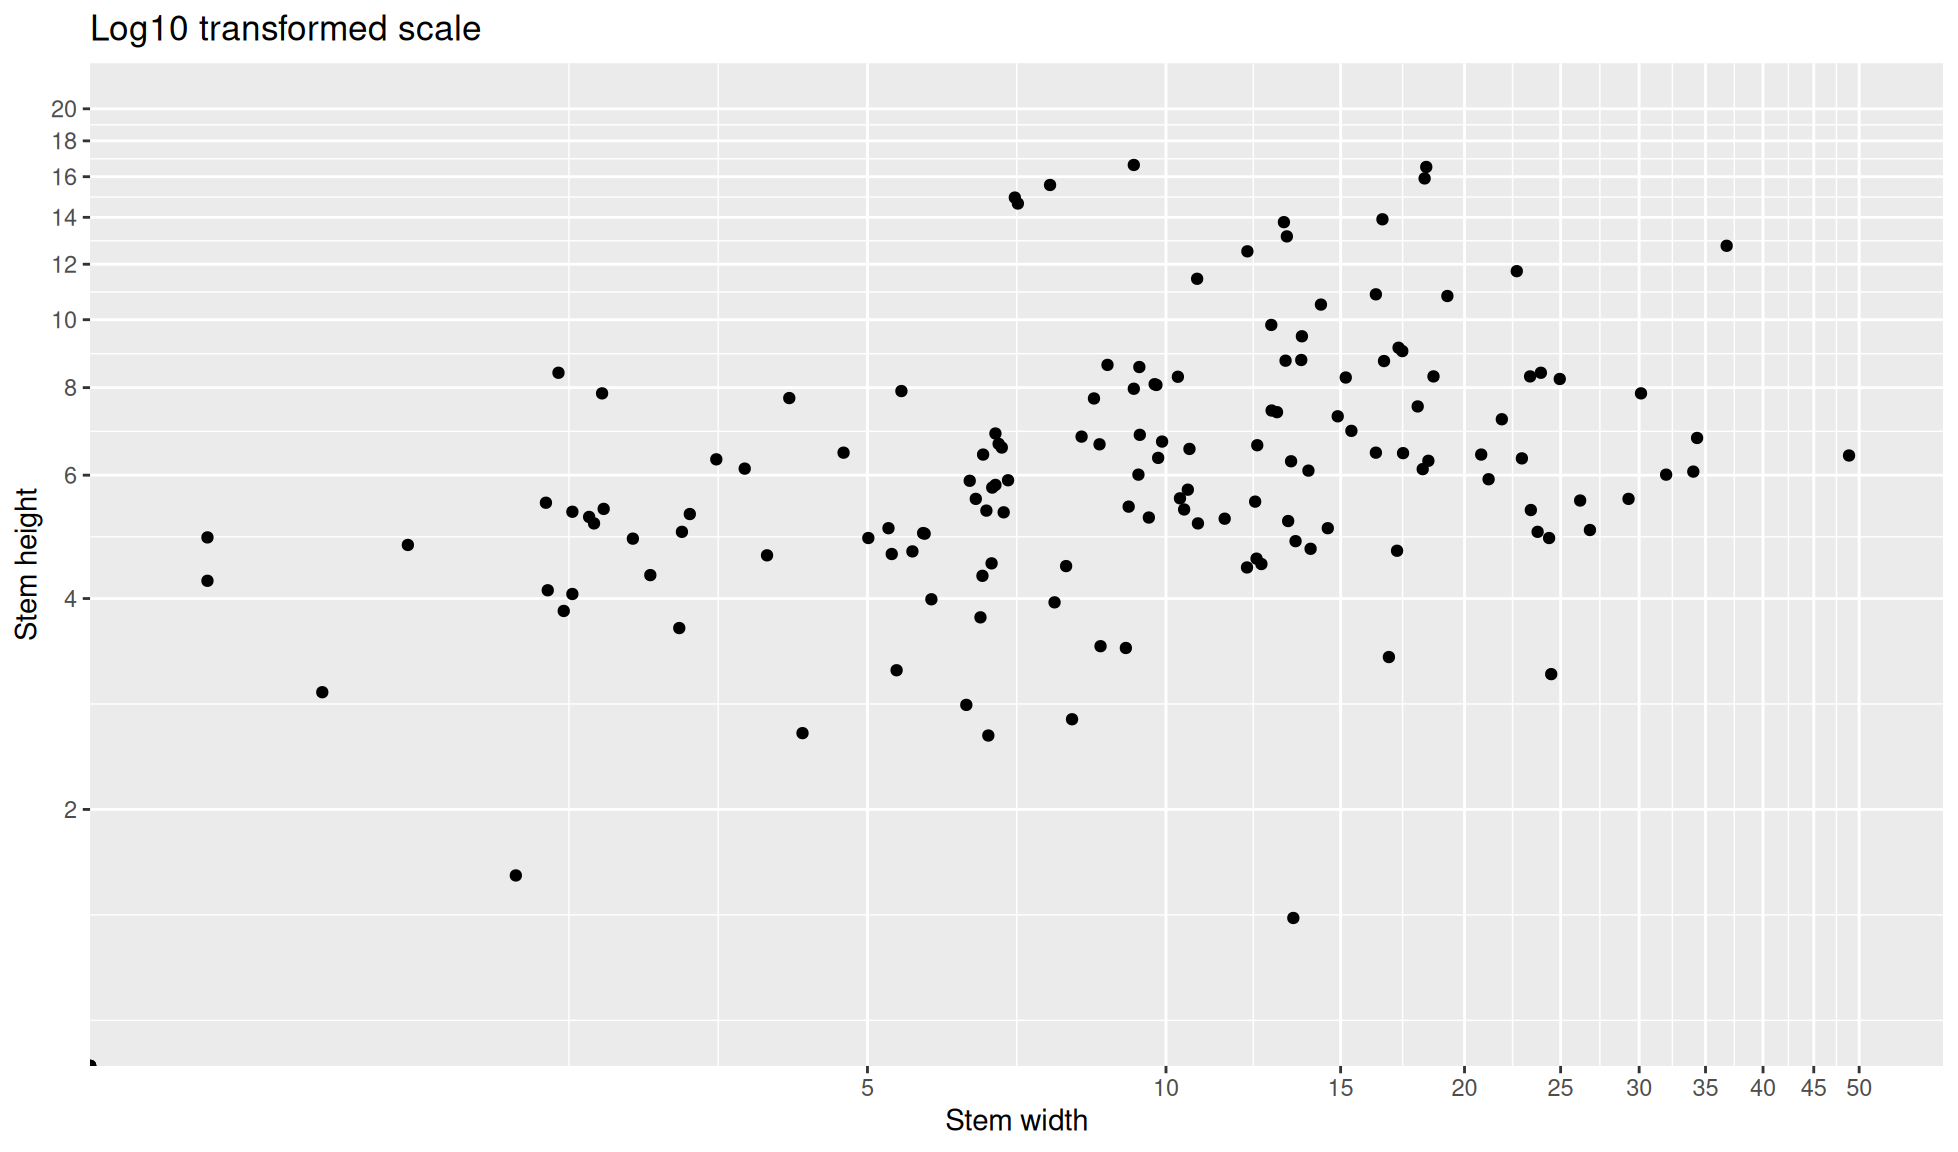
Create the default scatter plot. Transform both the x and y axis scales to log10.
mushroom_tbl |>
    ggplot2::ggplot(aes(x = stem_width, y = stem_height)) +
    ggplot2::geom_point() +
    #Log10 scale
    ggplot2::scale_x_log10(name="Stem width") +
    ggplot2::scale_y_log10(name="Stem height")
Warning in ggplot2::scale_x_log10(name = "Stem width"): log-10 transformation
introduced infinite values.Warning in ggplot2::scale_y_log10(name = "Stem height"): log-10 transformation
introduced infinite values.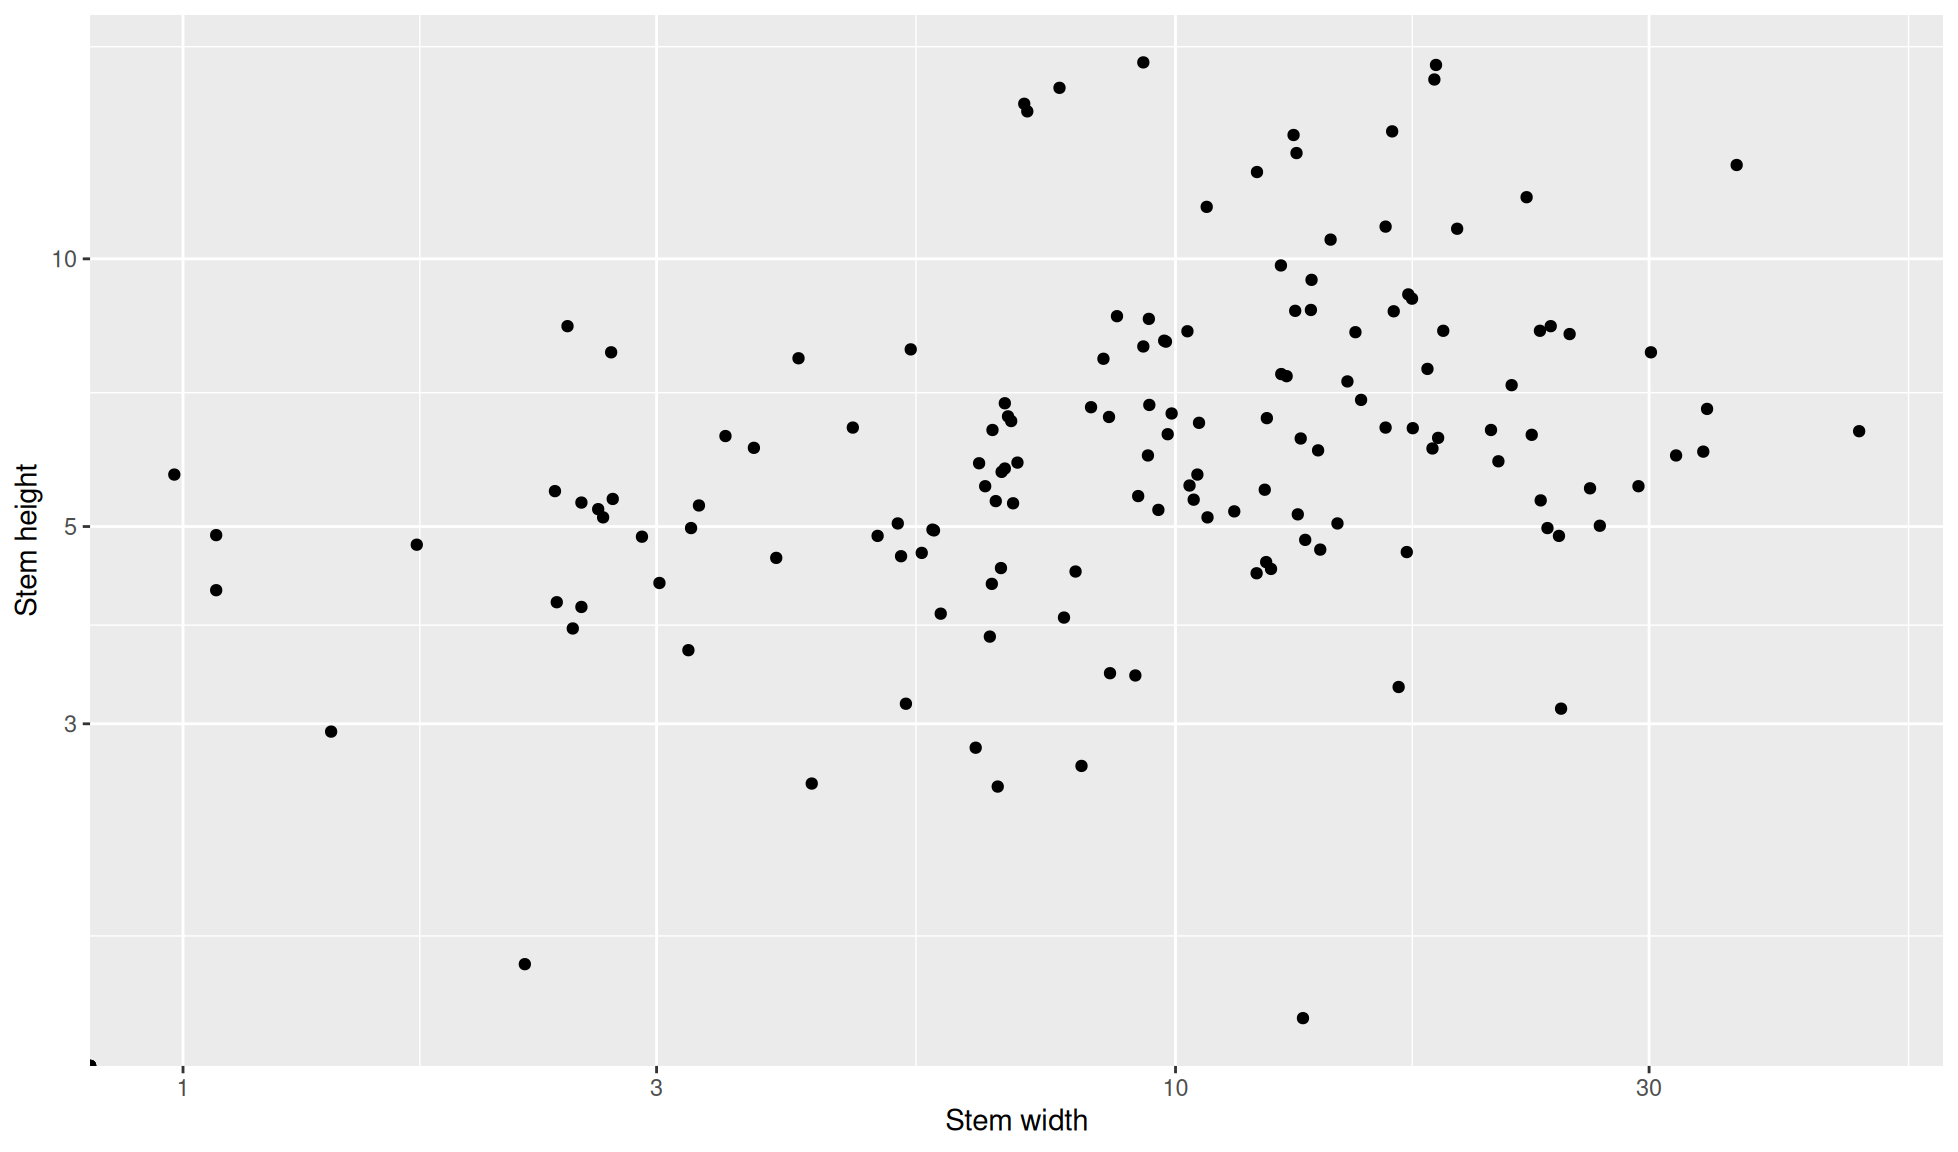
R has given a warning that the log-10 transformation has introduced infinite values. This occurs because log10(0) produces the result -inf in R. This warning can normally be ignored as long as the plot looks fine.
Sometimes this will cause a plot to become empty. This can be best avoided by removing rows were both the x and y axis values equal 0 with filter(). An example of this is below.
mushroom_tbl |>
    #Filter to remove rows with 0 values for stem width and height
    dplyr::filter(stem_width != 0 & stem_height != 0) |>
    ggplot2::ggplot(aes(x = stem_width, y = stem_height)) +
    ggplot2::geom_point() +
    #Log10 scale
    ggplot2::scale_x_log10(name="Stem width") +
    ggplot2::scale_y_log10(name="Stem height")
Square root
To convert an axis scale to square root one of the below components needs to be added:
ggplot2::scale_x_sqrt(): transform x axis to log10 scaleggplot2::scale_y_sqrt(): transform y axis to log10 scale
Create the default scatter plot. Transform both the x and y axis scales to square root.
mushroom_tbl |>
    ggplot2::ggplot(aes(x = stem_width, y = stem_height)) +
    ggplot2::geom_point() +
    #Sqrt scale
    ggplot2::scale_x_sqrt(name="Stem width") +
    ggplot2::scale_y_sqrt(name="Stem height")