library("patchwork")Patchwork
The patchwork package allows you to combine multiple ggplots into one graphic.
It is a separate package to tidyverse and requires installing. The install instructions are in the below link.
Once installed you can load the library.
Dataset
For demonstration we’ll load the mushroom_tbl data from the mgrtibbles package (hyperlink includes install instructions). For easier plot visualisation we’ll subsample the data.
#Subsampled dataset
#Set seed for random sampling
set.seed("483")
mushroom_tbl <- mgrtibbles::mushroom_tbl |>
    #Random sample of 150 rows
    dplyr::slice_sample(n = 150, replace=FALSE)
#Reset random seed to normal operation
set.seed(NULL)Create ggplots
To create a patchwork we need a few ggplots saved as objects first.
#Bar chart
barchart <- mushroom_tbl |>
    ggplot2::ggplot(aes(x = class)) +
    ggplot2::geom_bar()
#Histogram
histogram <- mushroom_tbl |>
    ggplot2::ggplot(aes(x = cap_diameter)) +
    ggplot2::geom_histogram()
#Line graph
line <- mushroom_tbl |>
    ggplot2::ggplot(aes(x = stem_width, y = stem_height)) +
    ggplot2::geom_line()
#Scatter plot
point <- mushroom_tbl |>
    ggplot2::ggplot(aes(x = stem_width, y = stem_height)) +
    ggplot2::geom_point()
#Box plot
box <- mushroom_tbl |>
    ggplot2::ggplot(aes(x = class, y = cap_diameter)) +
    ggplot2::geom_boxplot()
Horizontal
To create a graphic with plots side by side you can use |.
The below code creates a graphic with the line and point ggplots side by side.
line | point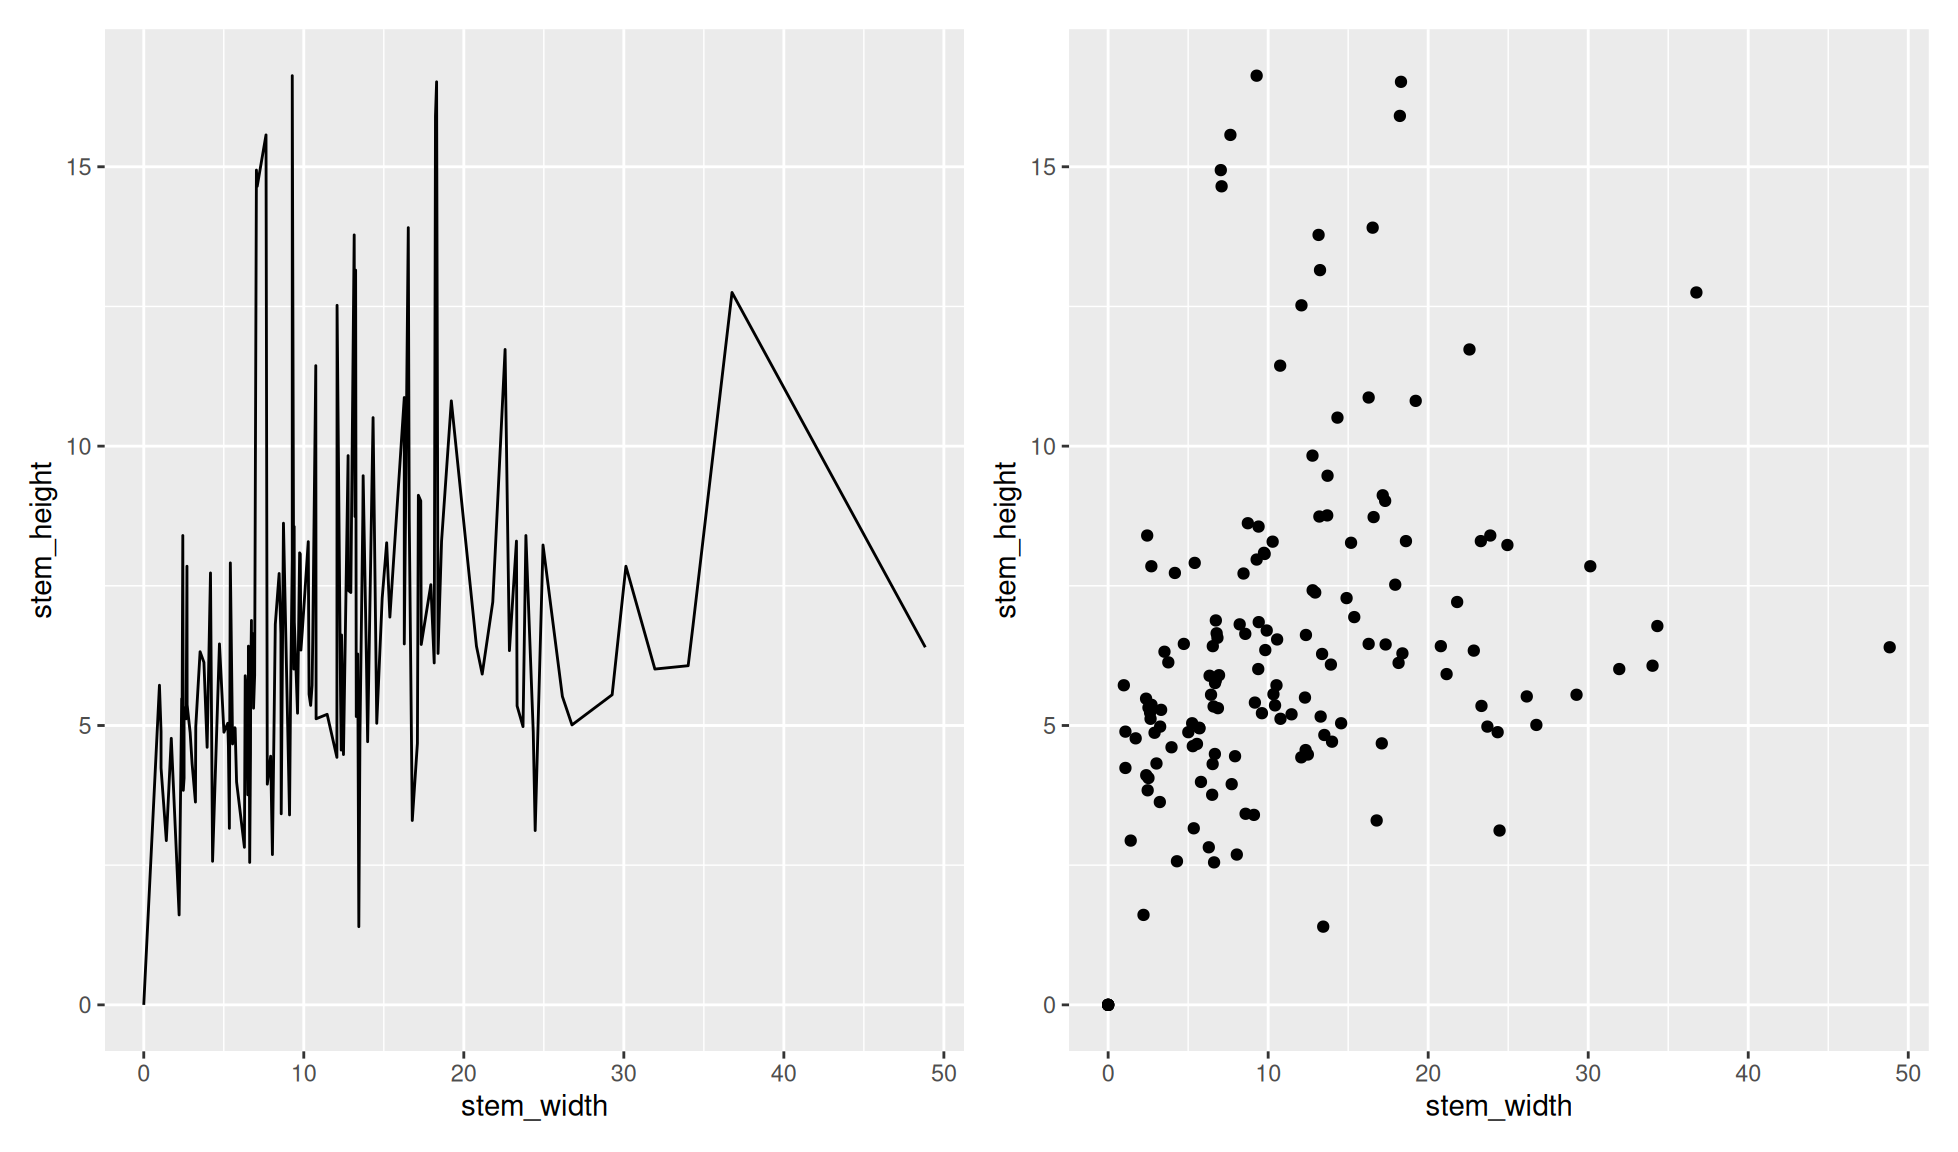
Vertical
To put one plot on top of another in a graphic you can use /
The below code creates a graphic with the barchart above the histogram.
barchart / histogram`stat_bin()` using `bins = 30`. Pick better value `binwidth`.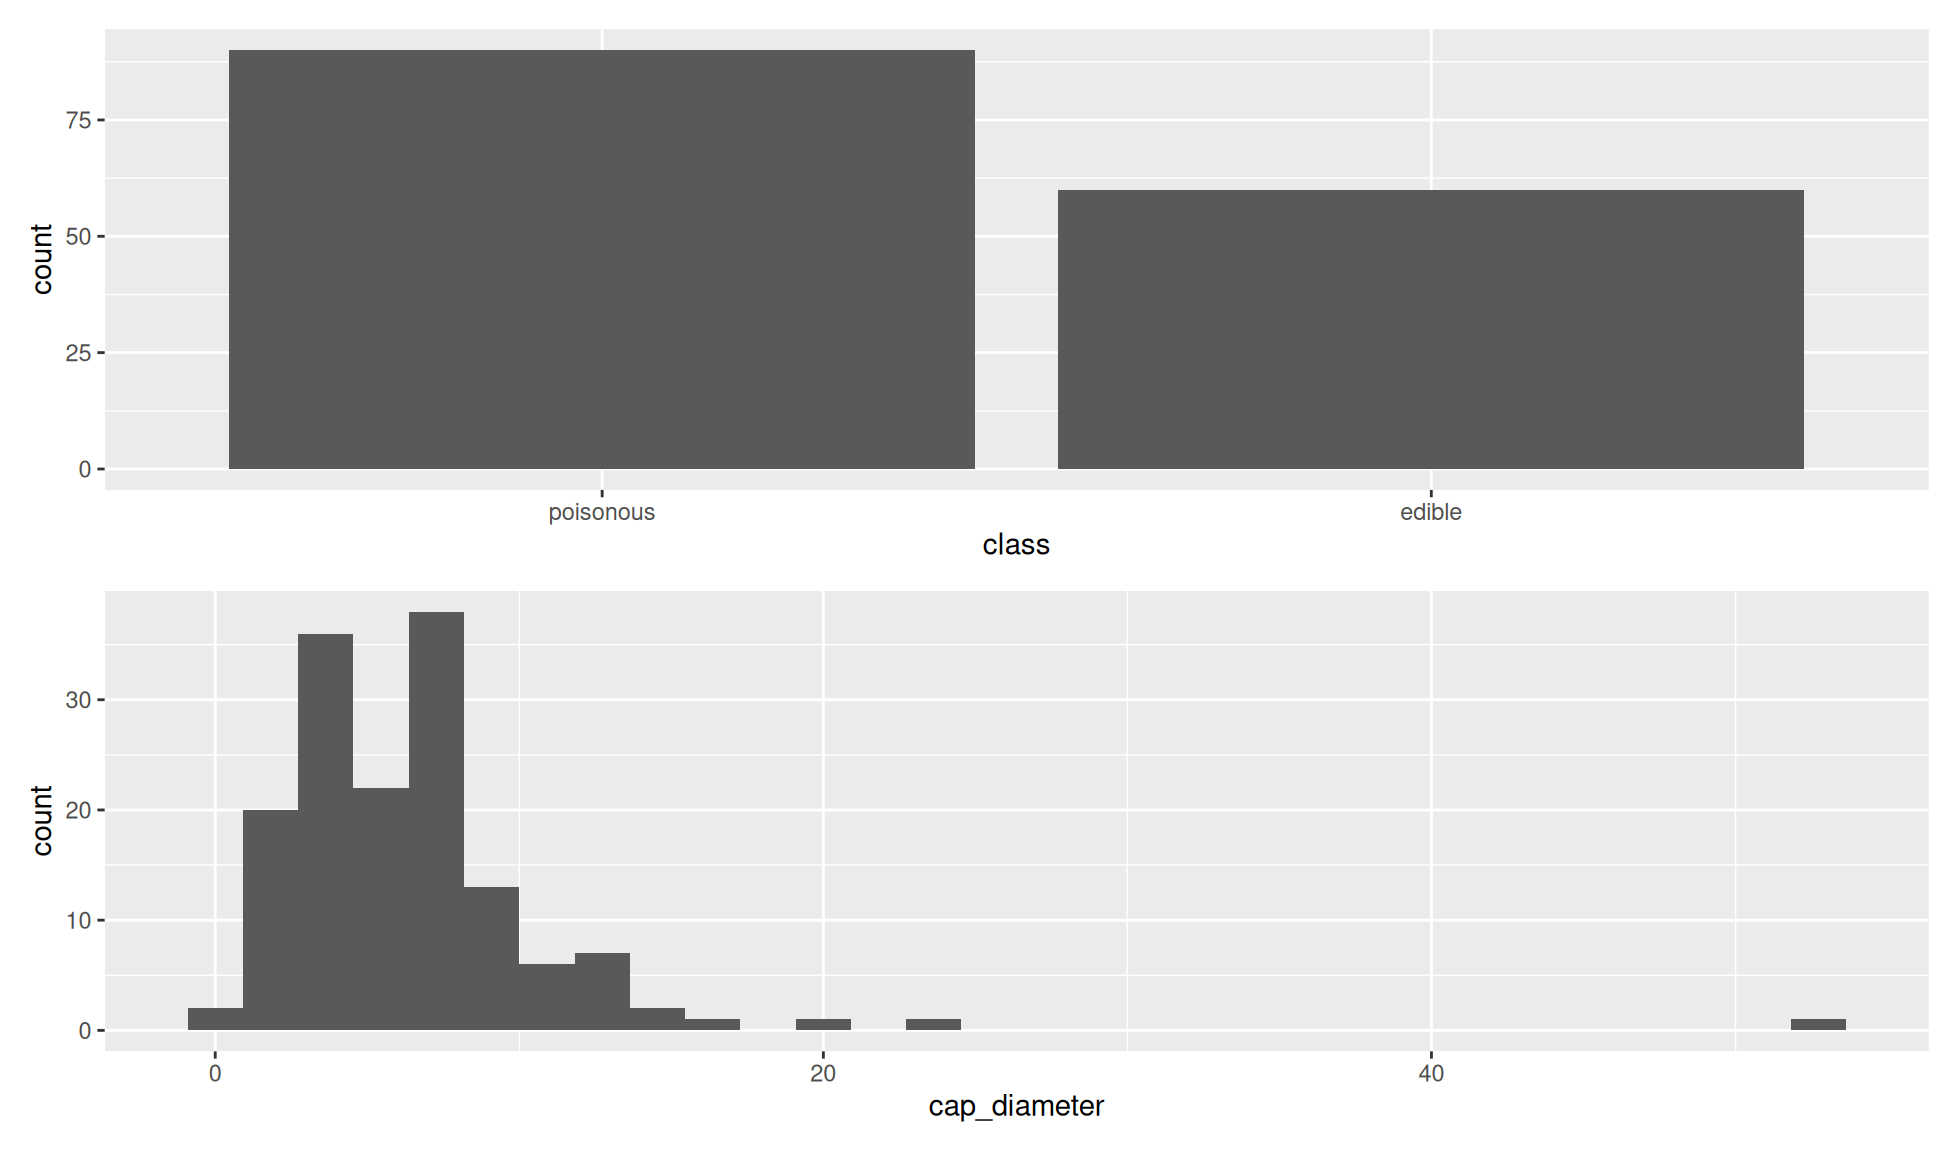
Grid
A more complicated graphic can be created by mixing the use of | and /. If doing this it is common to put all the plots in the same row in brackets ().
Example code and plot below.
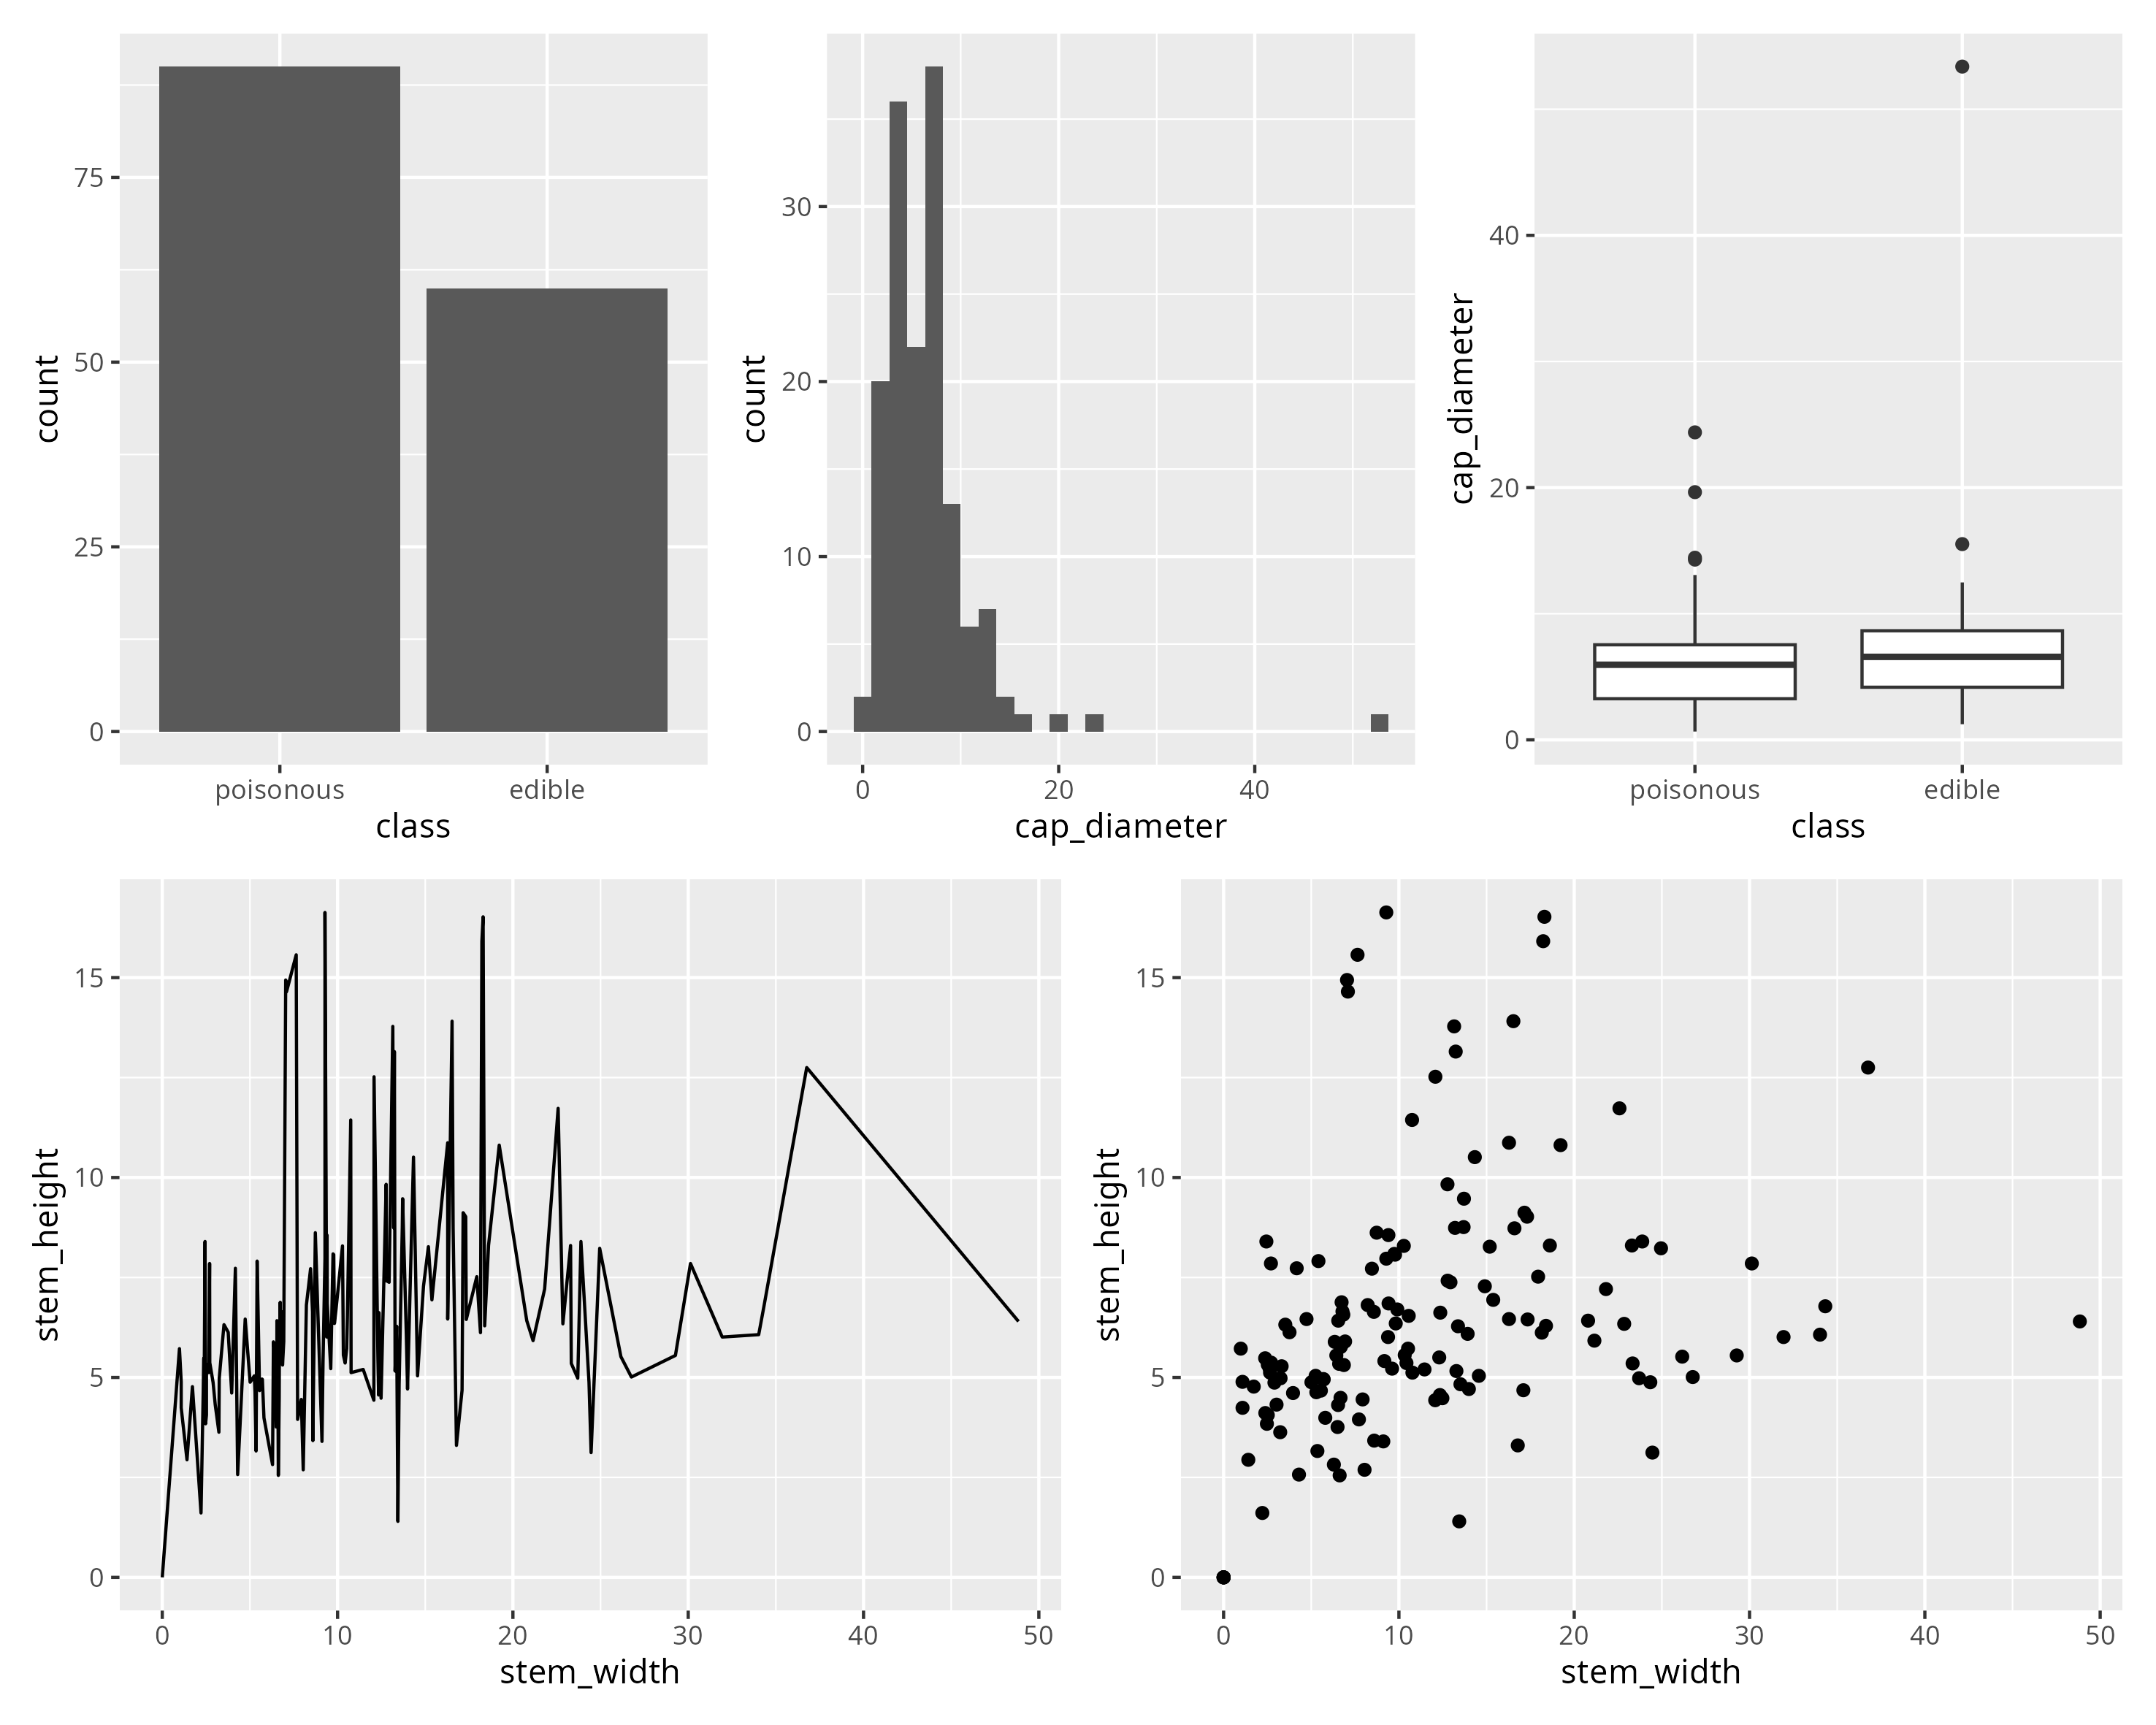
(barchart | histogram | box) / (line | point)`stat_bin()` using `bins = 30`. Pick better value `binwidth`.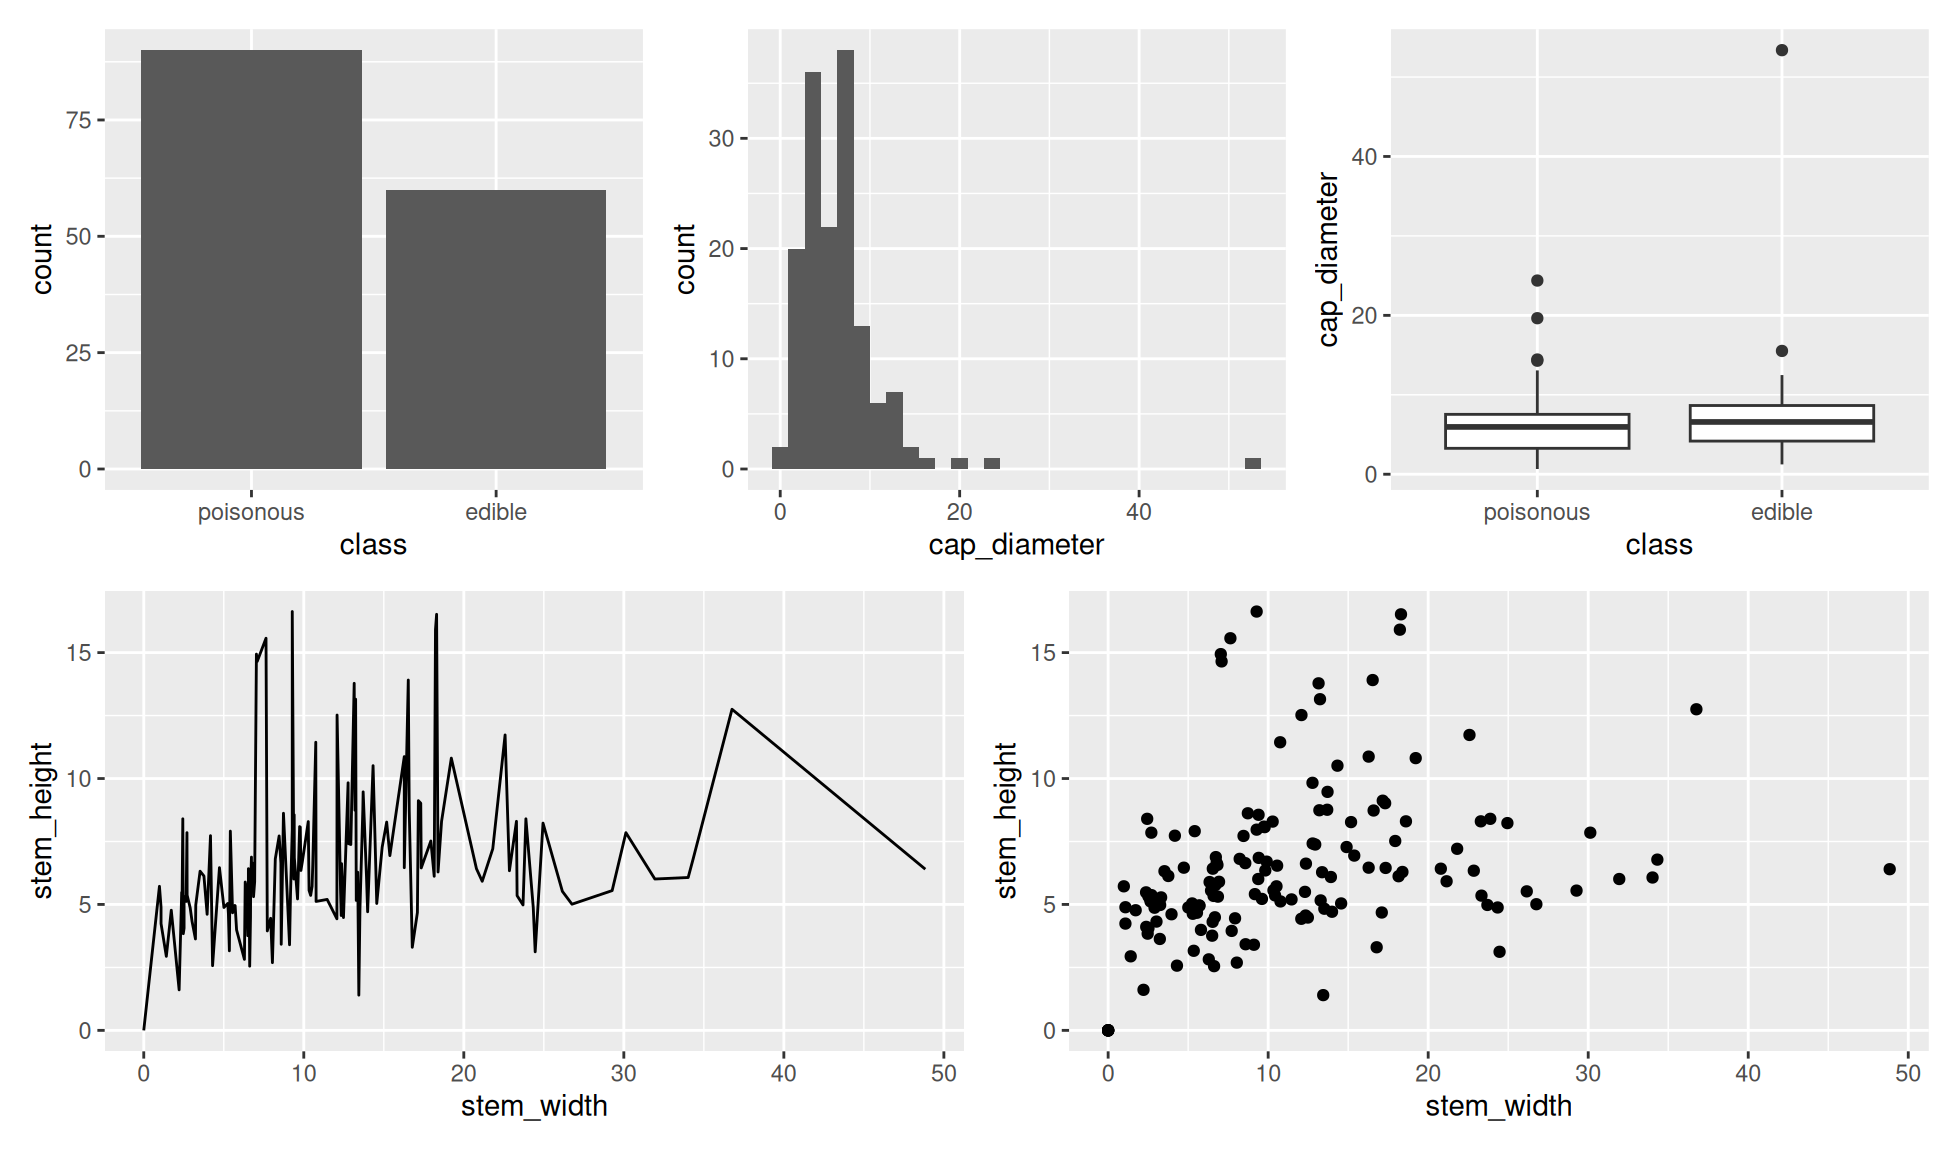
Save as a file
You can save a patchworked graphic with ggsave()
patchwork_ggplot <- (barchart | histogram | box) / (line | point)
ggplot2::ggsave(filename="images/patchwork.png", plot=patchwork_ggplot,
                device="png", units="mm", height=200, width = 200)
`stat_bin()` using `bins = 30`. Pick better value `binwidth`.The PNG file contains the following image:
Layout
As you may have noticed when laying out the plots on a graphic patchwork will divide spaces equally between the rows and the columns within each row. In the last plot:
- Each of the 2 rows are given 50% of the height
- The first row has 3 plots so each plot is given a third of the graphic width
- The second row has 2 plots so each plot is given a half of the graphic width
There are many ways to control the layout. To see these various methods please check the following link: