crab_age_weight_tbl <- mgrtibbles::crab_age_pred_tbl |>
    dplyr::slice(1:200) |>
dplyr::select(Weight, Age)Basic plot
In this page we will create a simple scatter/dot plot with ggplot2. This will demonstrate the basic anatomy of ggplot2 code.
Dataset
For demonstration we’ll load the crab_age_pred_tbl data from the mgrtibbles package (hyperlink includes install instructions). Additionally, we’ll slice out the first 200 rows and select the columns we will utilise in the plot for a clear demonstration.
Plot
Let’s create a simple dot/scatter plot of crab age against weight.
One of the useful features of a ggplot object is that you can assign it to a variable name (scatter_plot <-). This allows you to edit it, save it to a file, and display it. These features are covered in further pages.
#Create ggplot2 object and set the aesthetics
scatter_plot <-
    ggplot2::ggplot(data=crab_age_weight_tbl, mapping=aes(x=Age, y=Weight)) +
    #Set plot as a dot/scatter plot
    ggplot2::geom_point() +
    #Add title to plot
    labs(title="Crab age against weight scatter plot")
#Display plot
scatter_plot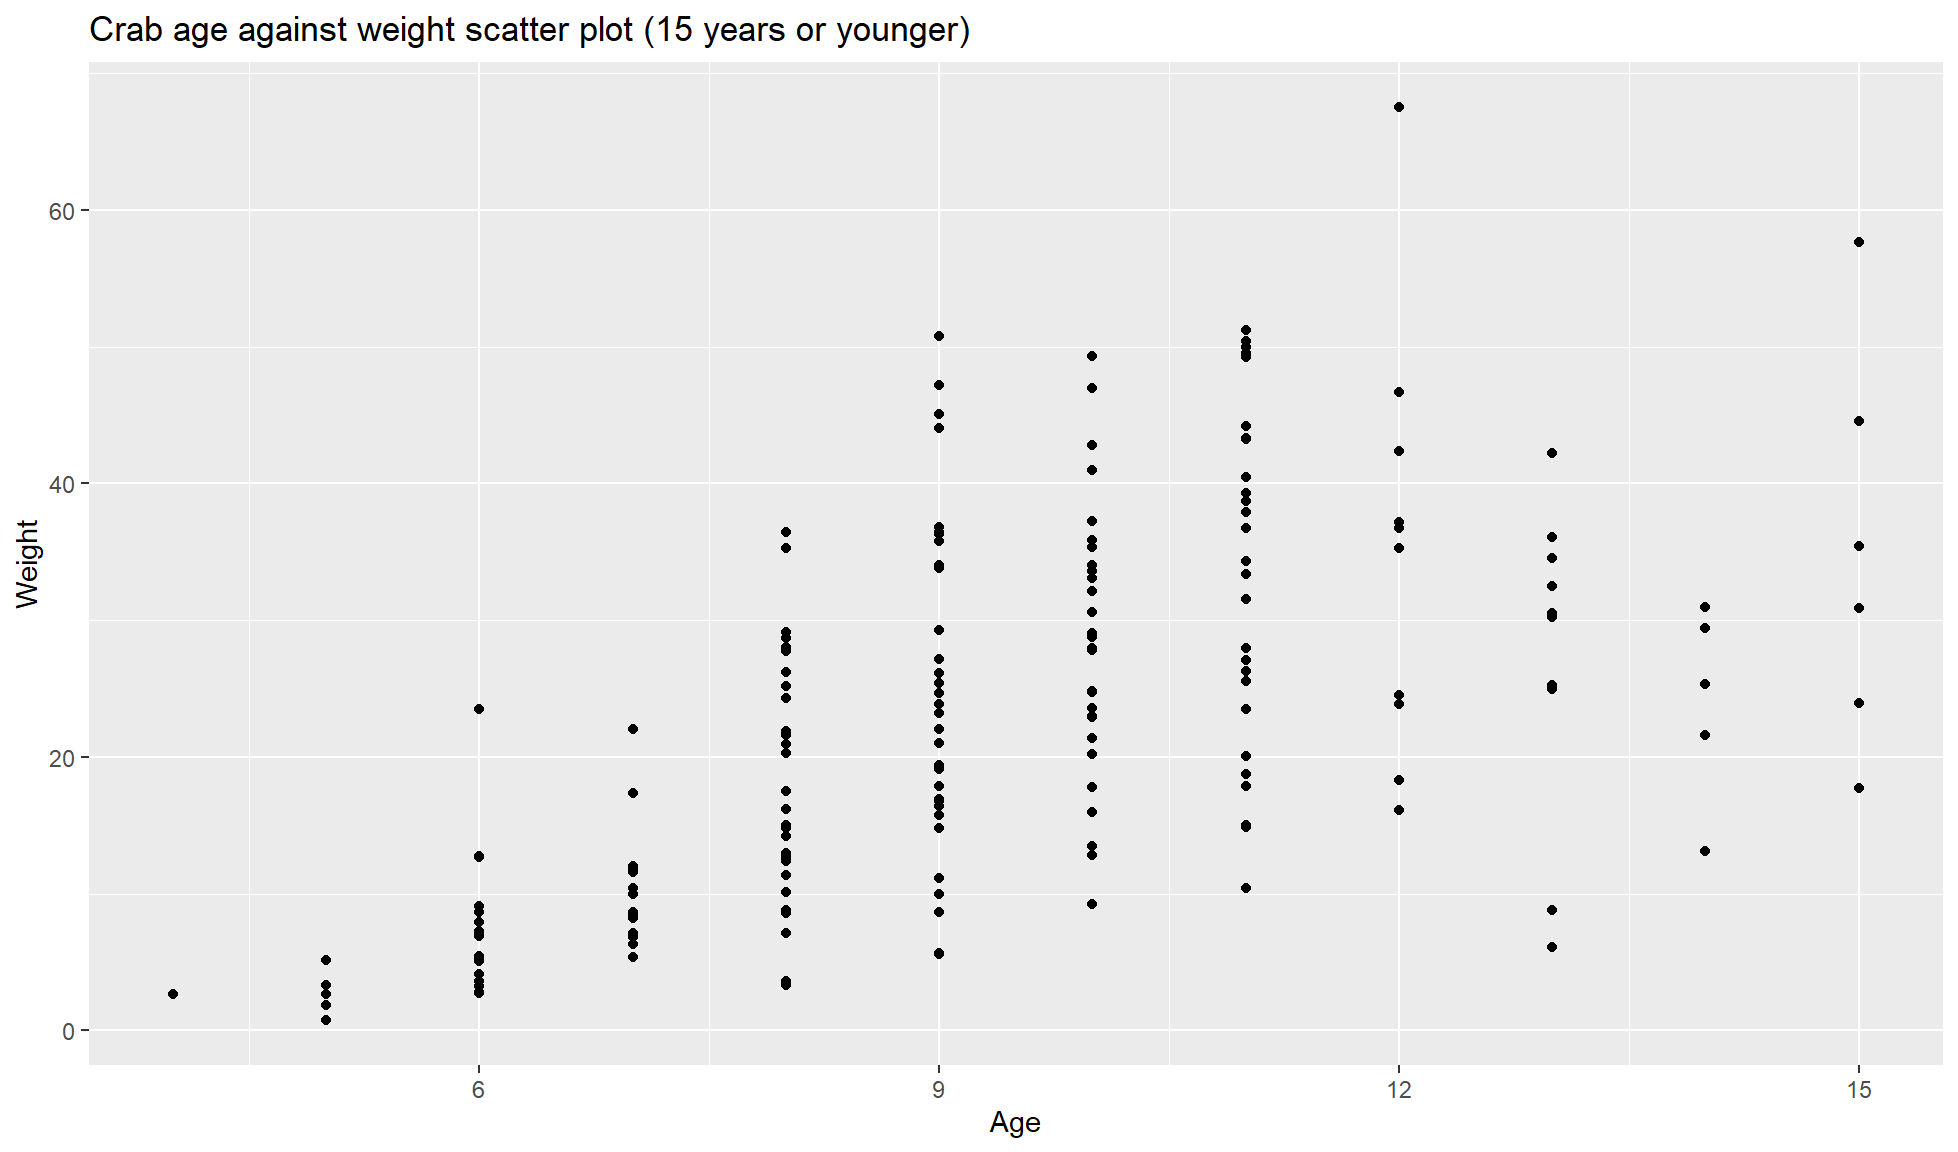
We have three lines, each with a function, for our ggplot2 code. They are described below.
Ggplot object creation
To create a ggplot object we use the function ggplot2::ggplot() and provide it with 2 different parts.
The first part is the data (data=crab_age_weight_tbl). Data for ggplot() needs to be long formatted so each column can be assigned to an aesthetic.
The second part is the aesthetic mapping information (mapping=aes(x=Age, y=Weight)). This maps the information/values in our data’s columns to the different aesthetics in our plot (e.g. axes). One important note is that you do not need to use quotes when referring to column names in the aes() brackets.
More information: Ggplot aesthetics
Components
Components can be added to the base ggplot object (ggplot2:ggplot()) with the + icon. Similar to piping (|>) this allows you to start simple and then build up more complex code to create sophisticated plots.
There are many components with most being layers.
More information: Components
Parameter names & piping
Parameter names (e.g. data=) do not always need to be specified as long as you provide them in the order the function expects. We do not need to provide ggplot2::ggplot() with the parmaeter names,data= and mapping=, as long as we provide the data first and the mapping second.
Since the data= parameter is first we can pipe our data/tibble/data.frame to our ggplot2::ggplot() function. This is useful if you want to carry out some data manipulation unique to the plot you will create.
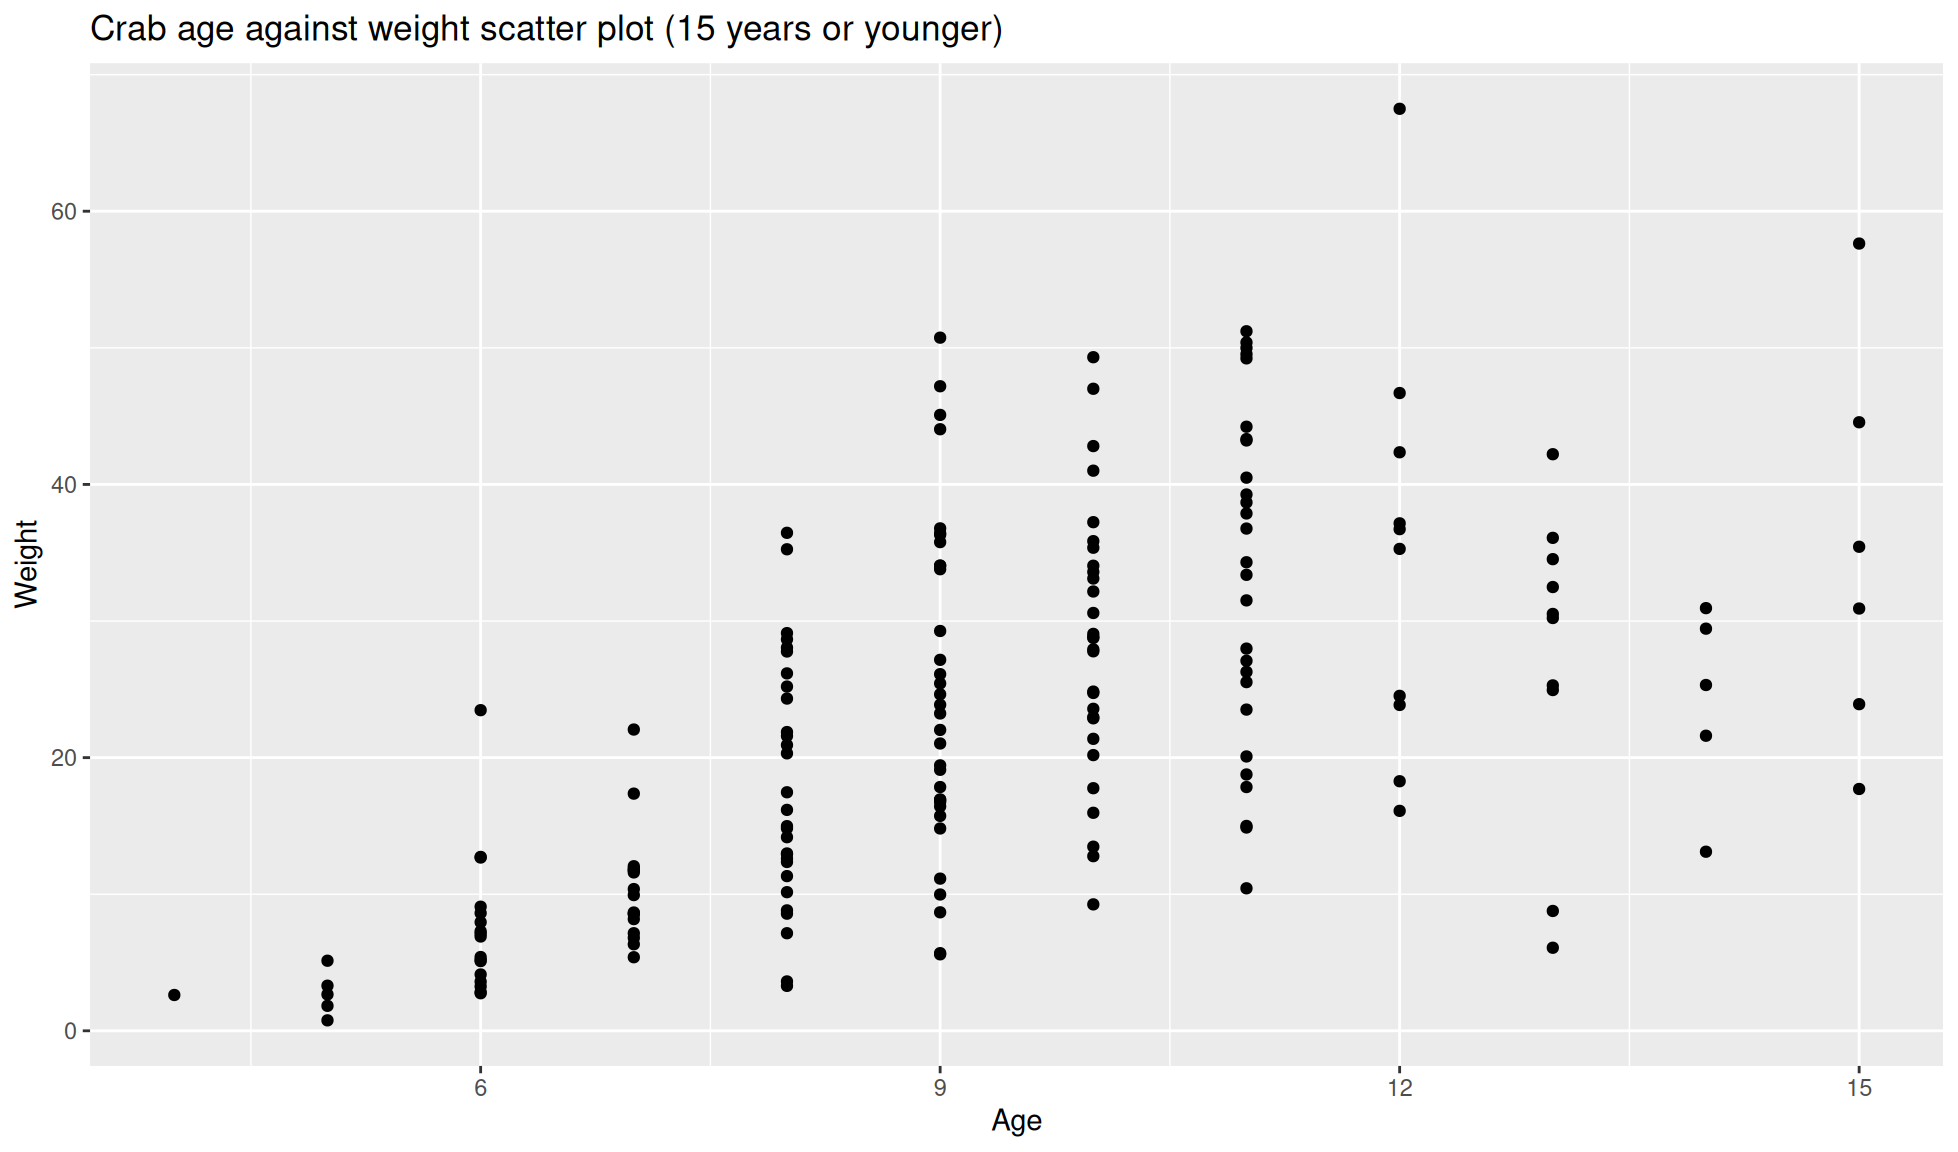
#Scatter plot of age against weight for crabs that are 15 years old or younger
scatter_plot <- crab_age_weight_tbl |>
    #Filter to keep crabs with an age up to 15 years
    dplyr::filter(Age <= 15) |>
    #Create ggplot2 object and set the aesthetics
    ggplot2::ggplot(aes(x=Age, y=Weight)) +
    #Set plot as a dot/scatter plot
    ggplot2::geom_point() +
    #Add title to plot
    labs(title="Crab age against weight scatter plot (15 years or younger)")
scatter_plot