#Load package
library("mgrtibbles")
#Set seed for random sampling
set.seed("483")
#mushroom_tbl tibble for demonstration
mushroom_tbl <- mgrtibbles::mushroom_tbl |>
    #Random sample of 150 rows
    dplyr::slice_sample(n = 150, replace=FALSE)
#Reset random seed to normal operation
set.seed(NULL)Coordinate systems

The coordinate system (x and y) can be modified with various functions/components. This page will only show how to modify the aspect ratio with ggplot2::coord_fixed().
Other coordinate systems are in the below link.
Dataset
We’ll recreate a plot in the geom_point() chapter, so we’ll load the mushroom_tbl data from the mgrtibbles package (hyperlink includes install instructions). We will extract a random sample of 150 rows with slice_sample().
Fixed ratio
By default when a ggplot is created the x and y axis will each take up as much space as the width and height the plotting area allows. However, this can lead to an extreme aspect ratio for the x and y axes. This may be unwanted for certain types of data. For example, ordination plots (such as PCoA and NMDs) are generally better with an aspect ratio of 1:1.
To control the aspect ratio of the x and y axes the function/component ggplot2::coord_fixed() can be added. The ratio can be specified with the option ratio=. The numeric value equals the y:x ratio. Examples:
ratio=1= 1:1 y:x ratioratio=5= 5:1 y:x ratioratio=1/5= 1:5 y:x ratio
Create the default scatter plot.
In this case we will have an aspect ratio of 1 for the x and y axis. This is carried out by adding ggplot2::coord_fixed(ratio = 1).
mushroom_tbl |>
    ggplot2::ggplot(aes(x = stem_width, y = stem_height)) +
    ggplot2::geom_point() +
    #Fixed aspect ratio
    ggplot2::coord_fixed(ratio = 1)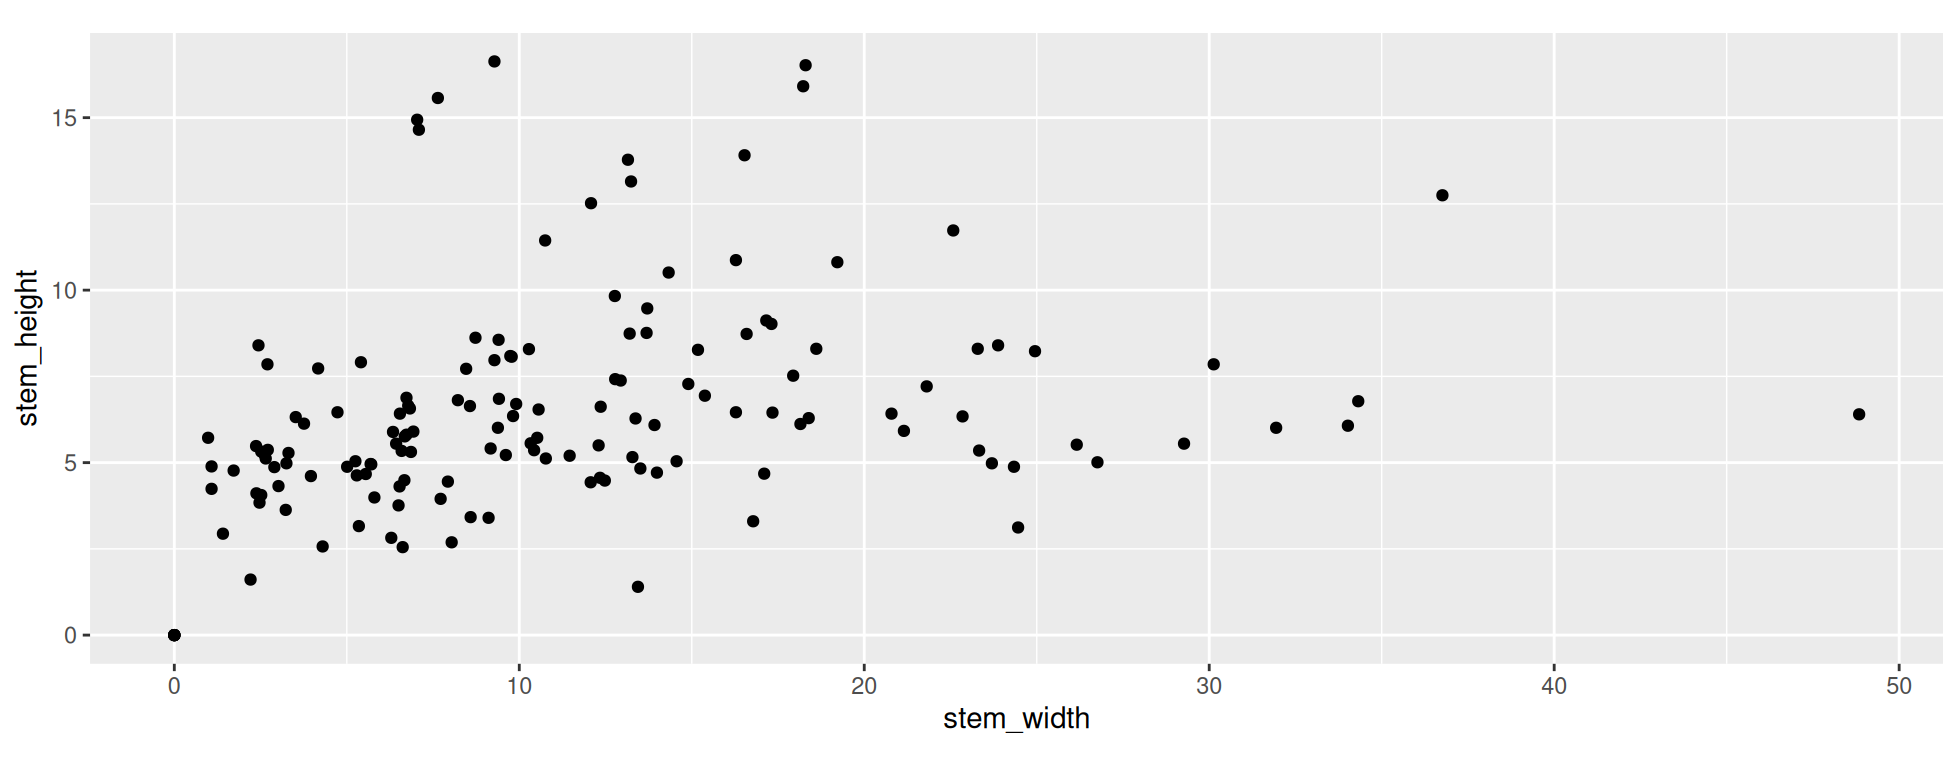
In the above plot you will notice there is more than 2 times the width than height. This is because the stem_width values go from 0 to a bit less than 50 whilst the stem_height values go from 0 to a bit more than 15. What is important is that the value from 0-10 (and continuing) takes up the same width and height in the resulting plot. This 1:1 ratio allows you to see relationships without the shape becoming warped by an uneven y:x ratio.
Note: When saving a plot with ggsave() ensure your chosen height and width have the same/similar aspect ratio. Otherwise you may end up with blank space on the sides or the top and bottom.