#Library
library("mgrtibbles")
#Data
amphibian_div_tbl <-
    mgrtibbles::amphibian_div_tbl |>
    #Select to retain only the iucn_2cat, Order, and Family columns
    dplyr::select(iucn_2cat,Order,Family) |>
    #Drop any rows with an NA
tidyr::drop_na()Ggsave

To save a ggplot object as an image the function ggplot2::ggsave() can be used.
Dataset
For demonstration we’ll load the amphibian_div_tbl data from the mgrtibbles package (hyperlink includes install instructions). Additionally, we’ll select the columns iucn_2cat, Order, and Family which we will use for plotting. Then we’ll remove any rows with an NA value using tidyr::drop_na.
Ggplot2 object creation
To save a plot we first need to create a ggplot2 object containing a plot. Instead of calling the functions to output the plot we will instead save it to an object.
Create a bar chart of the iucn_2cat variable and save it to the object iucn_barchart. We will use this object to save to various files.
iucn_barchart <- amphibian_div_tbl |>
    ggplot2::ggplot(aes(x = iucn_2cat)) +
    ggplot2::geom_bar()
If we call the object we can display it like below.
iucn_barchart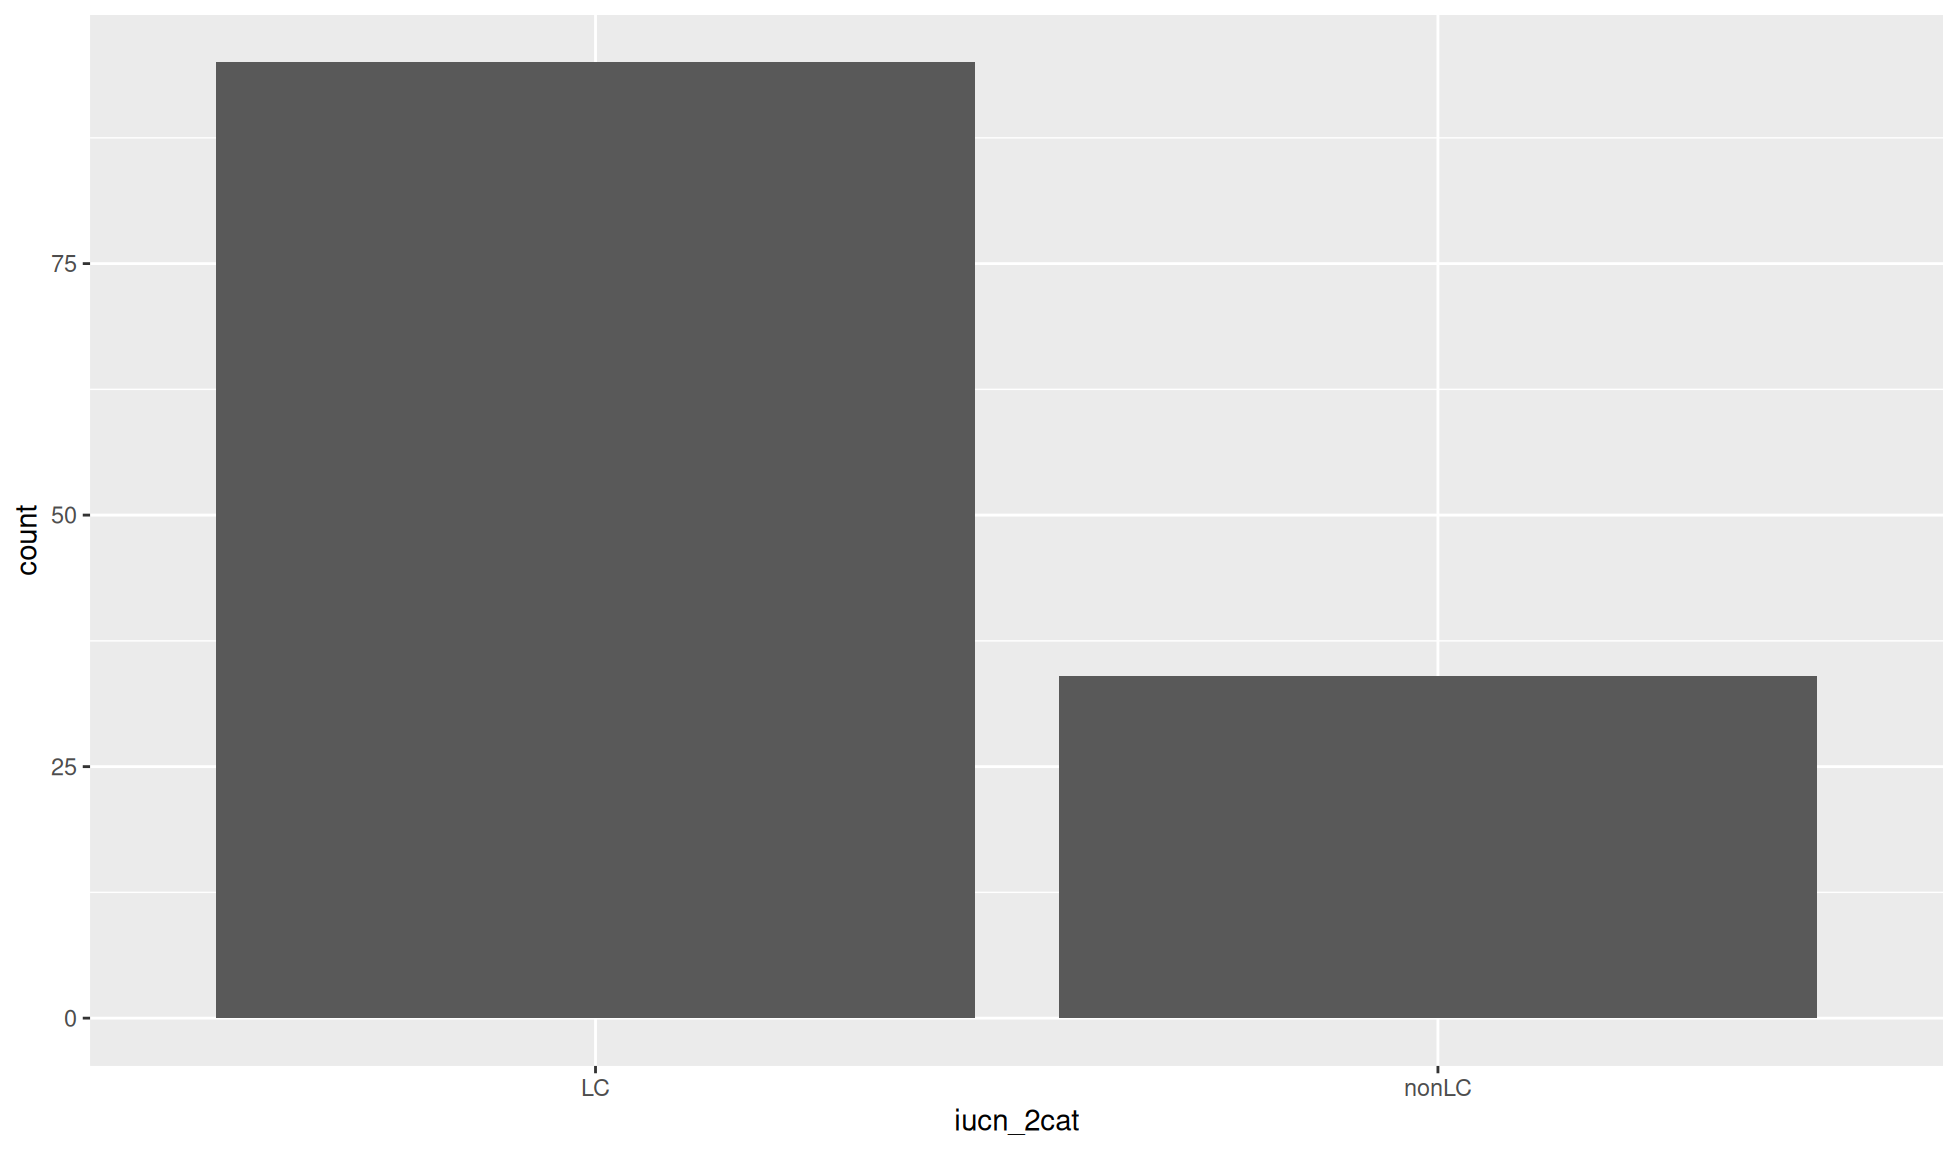
Save an image file
A common type of image file to save to is the PNG file.
Save/export the ggplot object iucn_barchart to a png file called “iucn_barchart.png”.
ggplot2::ggsave(filename="iucn_barchart.png", plot=iucn_barchart)Saving 10.2 x 6 in imageThe PNG file contains the following image:

Customisation
There are more options for the ggplot2::ggsave() function including:
device=: The type of the output file which includes “png”, “pdf”, “jpeg”, “svg”, “tiff”, and otherswidth=andheight=: The specified height and width of the output imageunits=: The measurement units when specifying the width and height.- Options include: inches (
in), centimetres (cm), millimetres (mm), and pixels (px)
- Options include: inches (
dpi=: Stands for dots per inch, i.e. the plot resolution- I always use 300 as it is the dpi most, if not all, journals ask for images to be in
Which units to choose?
I tend to use mm as I find it gives the second best precision. Pixels give the best precision level but I find physical measurements (inches, cm, mm) are more intuitive than using pixels. When using pixels the DPI (dot per inch) and number of pixels will determine the size of the image.
List of measurement conversions:
- 1 inch = 2.54cm
- 1cm = 10mm
- 1 inch = 300 pixels at 300 DPI
- 1 inch = 200 pixels at 200 DPI
- 1cm = 118 pixels at 300 DPI (300/2.54=118)
- 1cm = 79 pixels at 200 DPI (200/2.54=79)
Save an image with extra options
Lets save another PNG file specifying all these options.
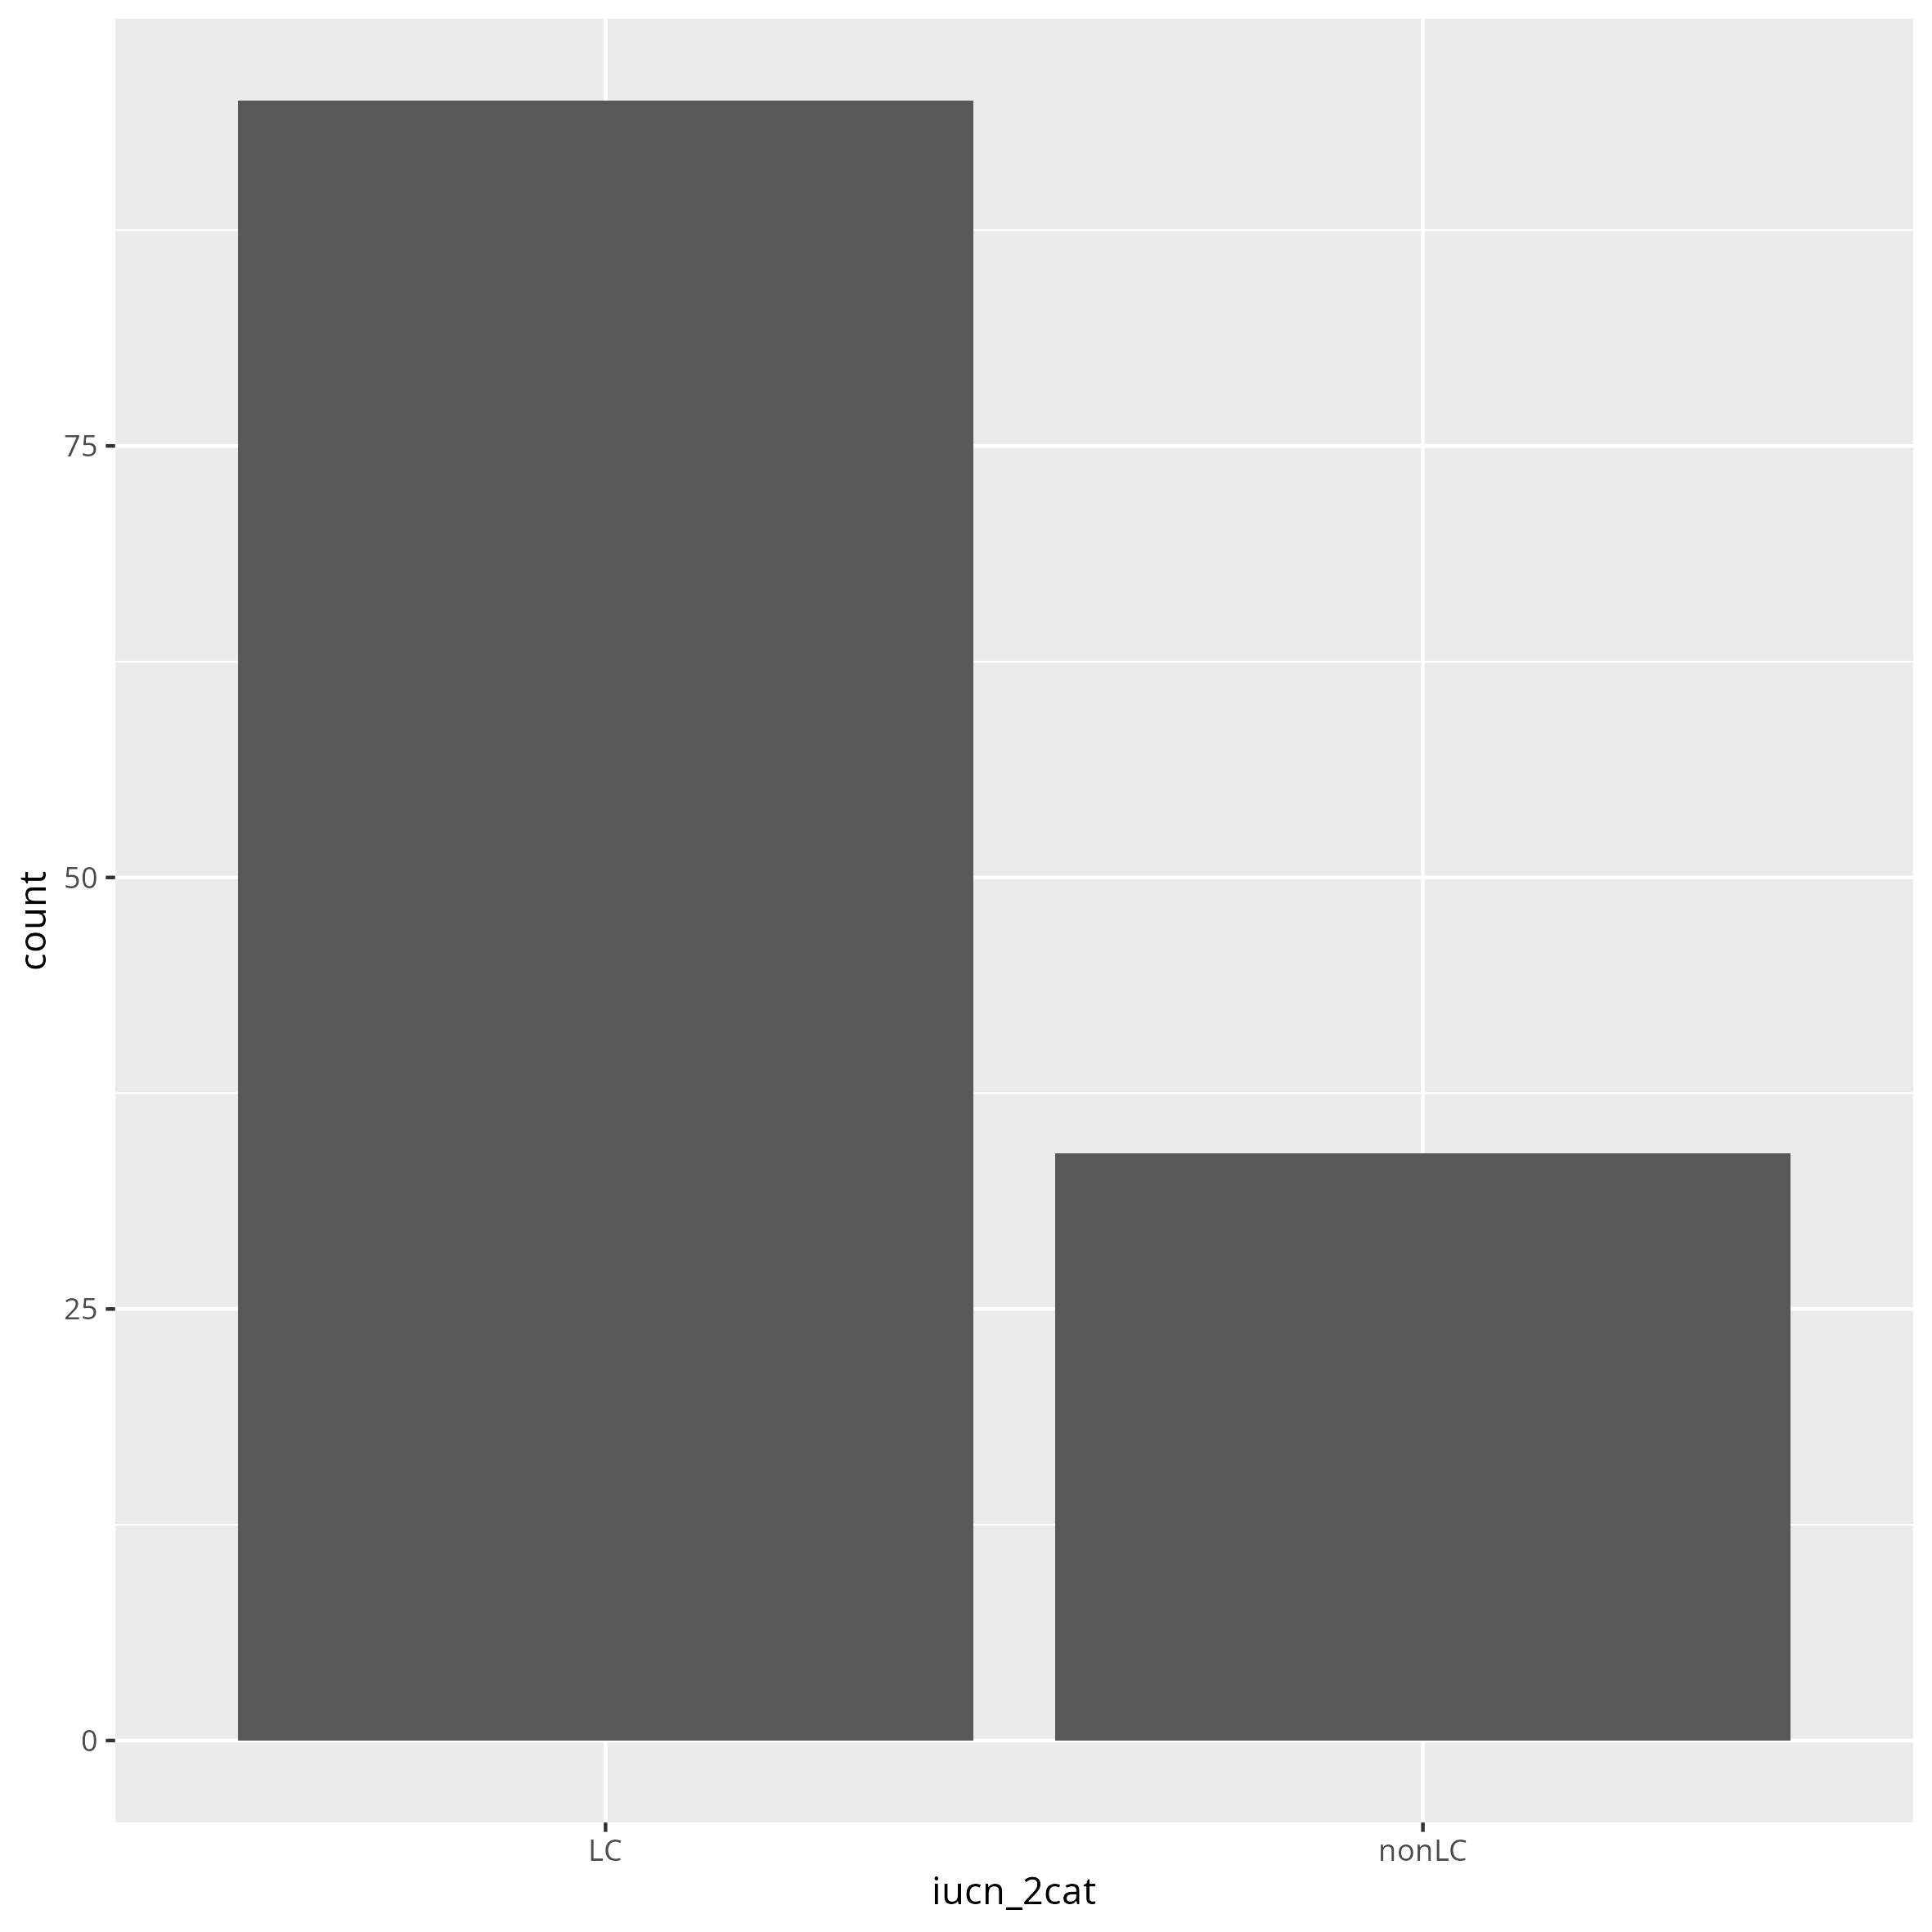
ggplot2::ggsave(filename="iucn_barchart_2.png", plot=iucn_barchart,
                device="png", units="mm", height=200, width=200)
The PNG file contains the following image:
Height and width choice
Making the height and width smaller or larger can make a plot clearer. It is best to choose these values through your knowledge, and trial and error. Some considerations include:
- Making a plot larger can allow you to visualise lots of points better.
- Making a plot smaller will make the text larger in comparison.
- The ratio of the width and height can be important. Square plots are good for ordination plots (e.g. PCoA) whilst plots with a larger height can be good for histograms.
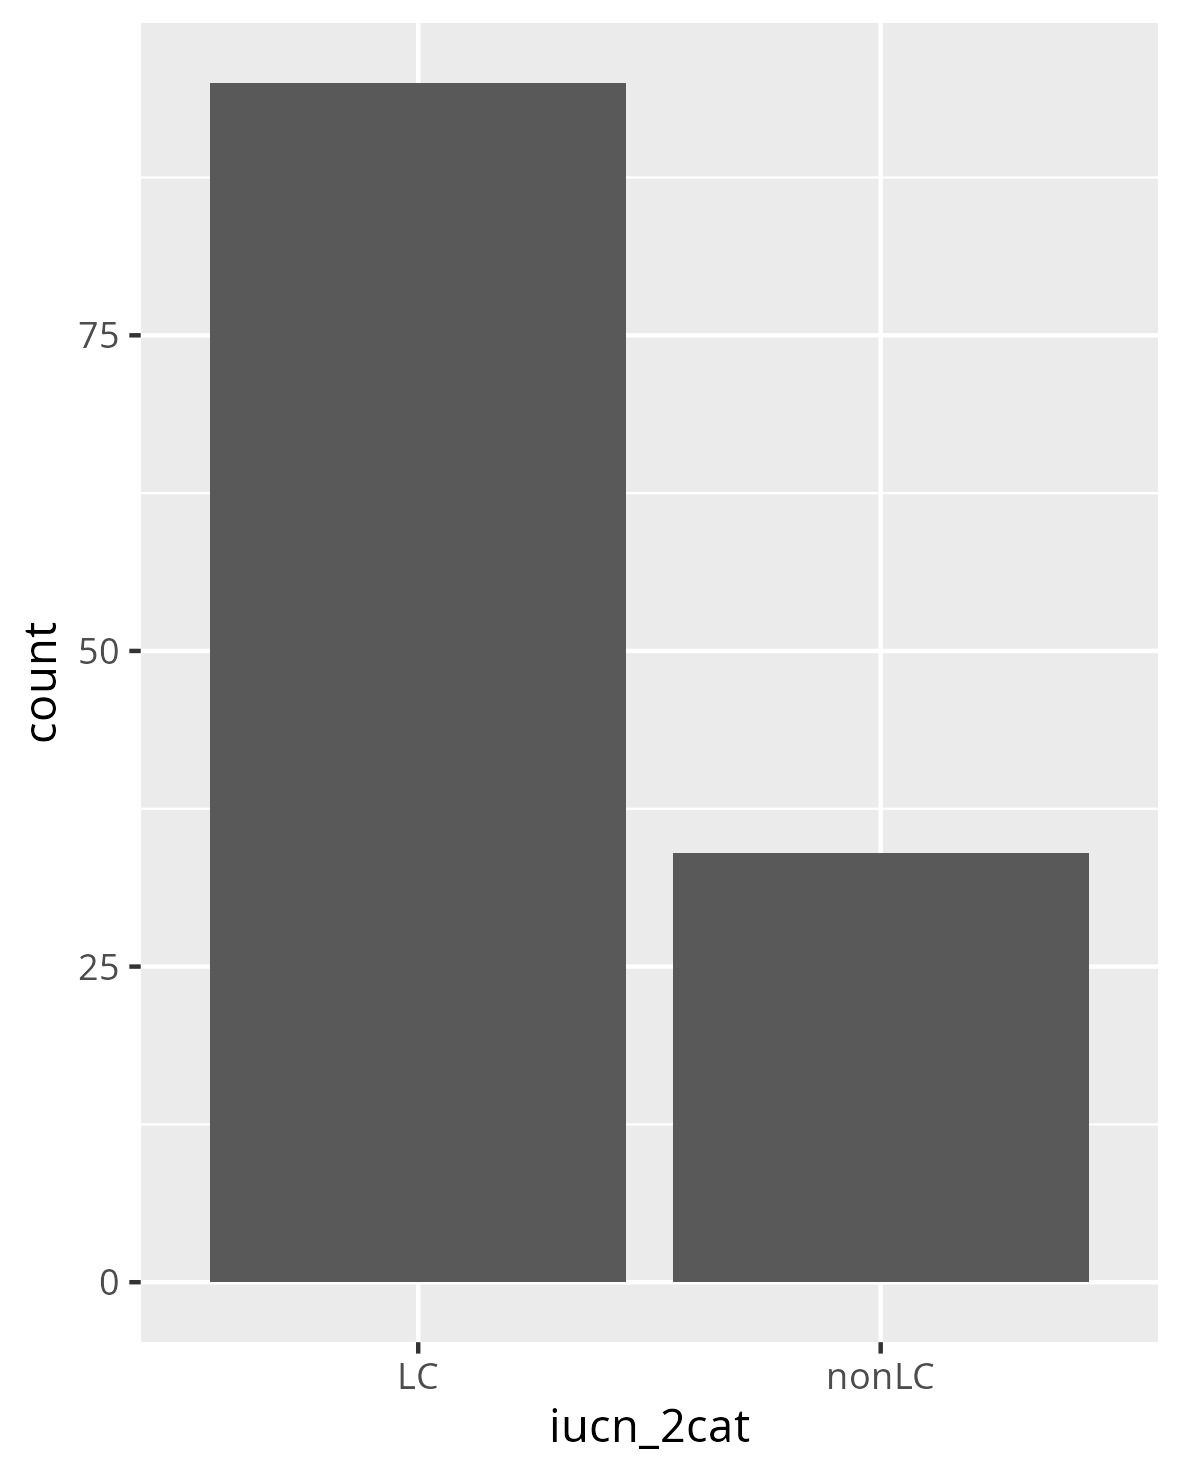
Let’s change the height and width to make a better output. We’ll choose quite small values as the plot is very compact, allowing the text to be bigger. Additionally, we’ll make the height larger than the width as there are only 2 x axis values whilst the y axis contains a continuous variable.
ggplot2::ggsave(filename="iucn_barchart_3.png", plot=iucn_barchart,
                device="png", units="mm", height=125, width=100)
The PNG file contains the following image: